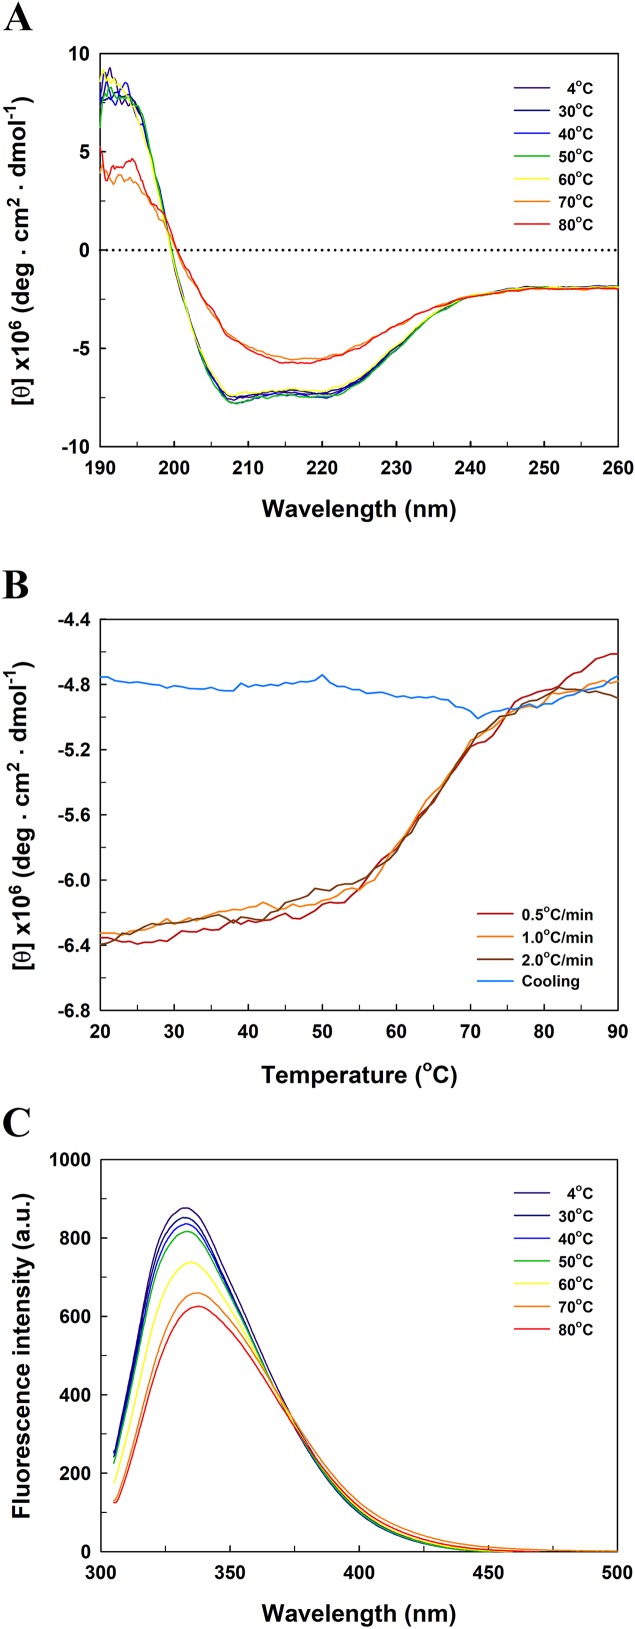
Figure 5. Far-UV CD and intrinsic tryptophan fluorescence spectra of EcPepQ.
(A) Temperature-dependent CD spectra of the enzyme. Far-UV CD spectra of the enzyme were recorded at the indicated temperatures over the wavelength range of 190–260 nm. (B) Transition and cooling curves of the enzyme . The temperature-induced unfolding of the enzyme was monitored at three different heating rates as aforementioned procedures. The blue line represents the cooling curve of the unfolded protein, which had been heated with a scan rate of 2.0 °C/min. (C) Temperature-dependent fluorescence spectra of the enzyme. Fluorescence spectra of the enzyme were recorded at the indicated temperatures over the emission wavelength range of 305–500 nm.

