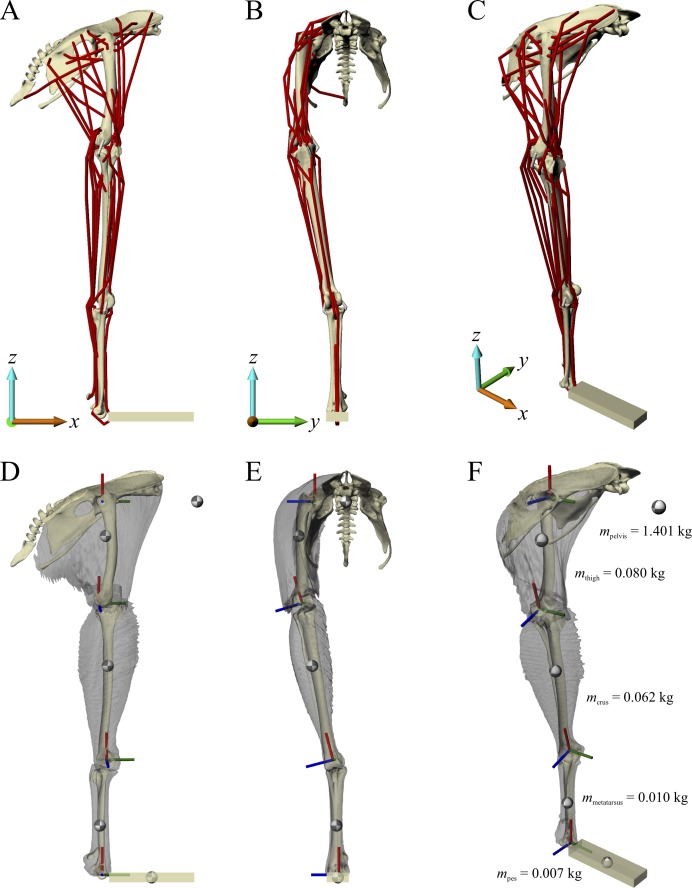
Figure 1. The musculoskeletal model of the chicken hindlimb developed in this study.
This is shown in the ‘neutral posture’ for all joints, that is, when all joint angles are zero. (A–C) Geometries of the musculotendon actuators in relation to the bones, in lateral (A), anterior (B) and oblique anterolateral (C) views. (D–E) Location and orientation of joint coordinate systems (red, green and blue axes), the centres of mass for each segment (grey and white balls) and the soft tissue volumes, derived from CT scans and used to calculate mass properties; these are shown in the same views as (A–C). Also reported in (F) are the masses for each segment; the pelvis segment represents the body as well as the contralateral limb. In (D–F), the flexion–extension axis of each joint is the blue axis. For scale, the length of each arrow in the triad of the global coordinate system is 40 mm.

