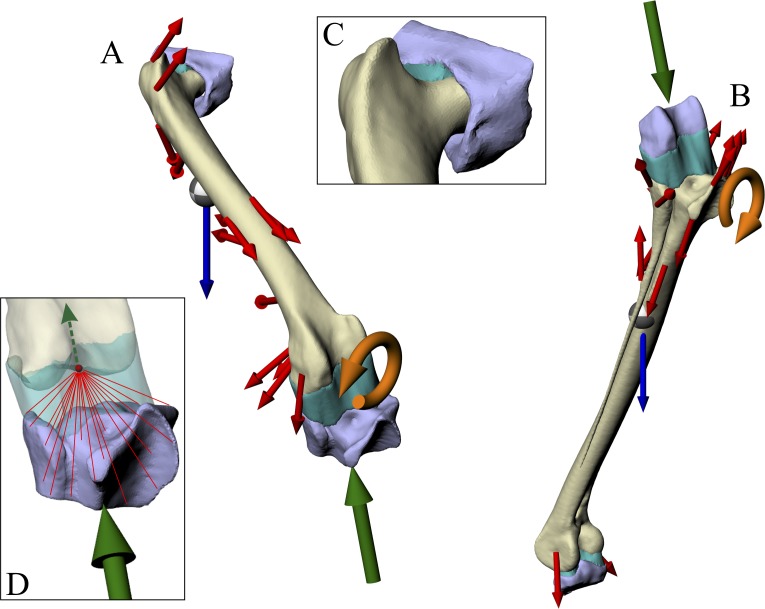
Figure 3. Geometry, forces and constraints involved in the finite element analysis of a given test posture.
(A and B) For each posture, two simulations were performed, one for the femur (A) and one for the tibiotarsus + fibula (B). Muscle and ligament forces are red, segment weights are blue, joint forces are green and joint moments are orange. The focal bones in each simulation were ‘bookended’ between their adjacent articulating bones, to which restraints or joint forces were applied. (C) The intervening soft tissues between focal bones and their neighbouring bones were modelled as a single homogenous volume (turquoise). (D) Knee joint forces were applied as a remote force: the force was applied to a remote point (knee joint centre, red dot), which was topologically attached to a neighbouring bone via constraint equations (red lines, schematic illustration only). Loads are not shown to scale.

