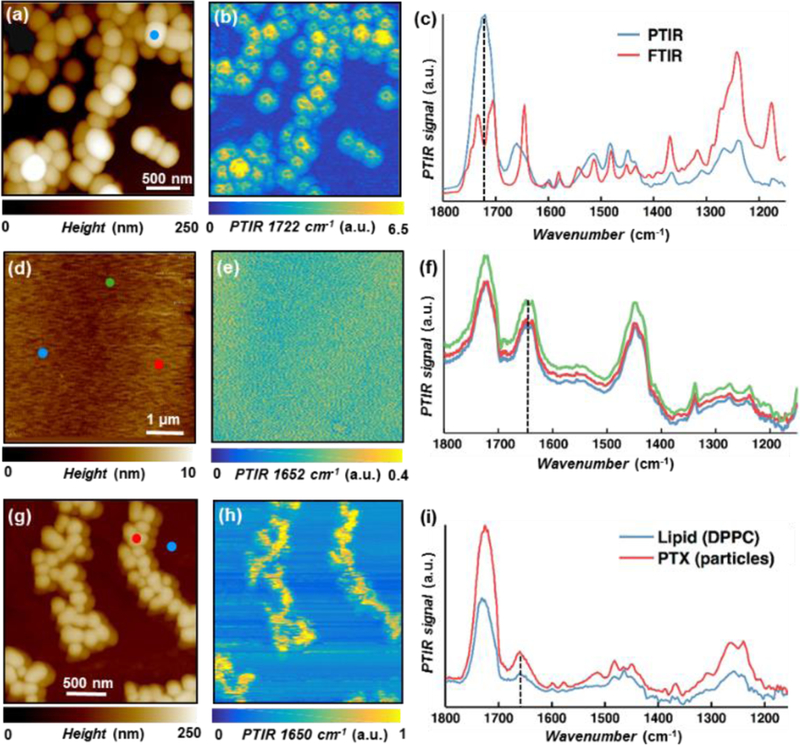
Fig. 2.

(a) AFM topography map, and (b) PTIR map (1722 cm−1, carboxylic acid stretching) of paclitaxel microcrystals. (c) Comparison between macroscale FTIR (red) and nanoscale PTIR spectra [blue, from marked position in panel (a)] of paclitaxel microcrystals, showing good agreement. (d) AFM topography map, (e) PTIR map (1652 cm−1, paclitaxel amide I), and (f) PTIR spectra [from the color-coded positions in panel (d)] of a paclitaxel loaded PBD-b-PEO film highlighting the film homogeneity. (g) AFM topography map, (h) PTIR map (1650 cm−1, paclitaxel amide I) and (i) PTIR spectra [from the color-coded positions in panel (g)] of a paclitaxel loaded DPPC film showing the partial segregation of paclitaxel nanocrystals from the DPPC film.
