Fig. 3.

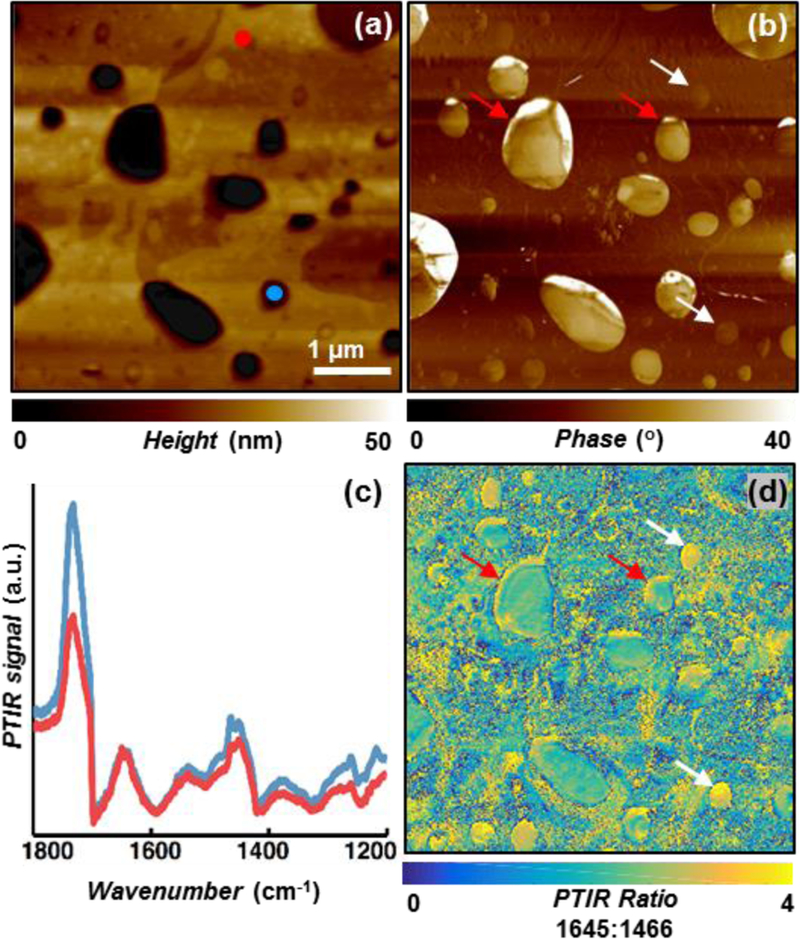
(a) AFM topography, and (b) phase map of paclitaxel loaded DPPC/PBD-b-PEO hybrid films showing strong heterogeneity. (c) PTIR spectra obtained at the marked locations in panel-(a) showing very similar spectra from the polymer-rich and lipid-rich domains. (d) PTIR ratio image obtained by dividing the paclitaxel amide I map (1645 cm−1) with respect to the polymer and lipid band (1466 cm−1) showing the complex and heterogeneous distribution of paclitaxel. Higher paclitaxel concentration is observed along several lipid-polymer phase boundaries (red arrows) and throughout some smaller domains (white arrows).
