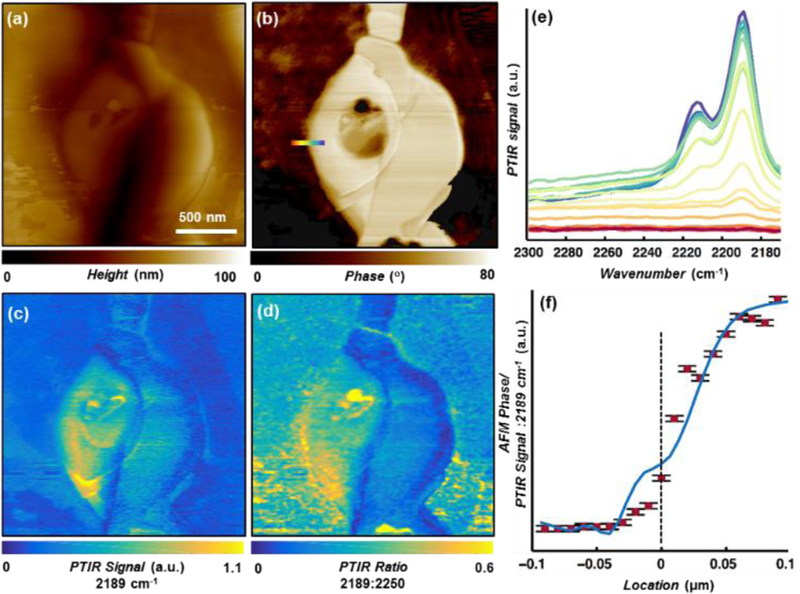
Fig. 4.

(a) AFM topography map, and (b) phase map of paclitaxel loaded d-DPPC/PBD-b-PEO hybrid films. (c) PTIR absorption map (2189 cm−1, d-DPPC symmetric CD2 stretching), and (d) PTIR ratio image obtained by dividing the d-DPPC symmetric CD2 stretching (2189 cm−1) map with respect to non-specific background absorption (2250 cm−1). (e) PTIR spectra obtained at the color-coded locations in panel-(b). (f) AFM phase line profile (blue) and 2189 cm−1 spectral intensity [red dots, derived from spectra in panel-(e)] across the color-coded location in panel-(b) showing an abrupt change in chemical composition. The line at “0” μm marks the edge of the lipid-rich domain, as observed in the topography image in panel-(a). Error bars represent a single standard deviation in the determination of the PTIR signal intensity.
