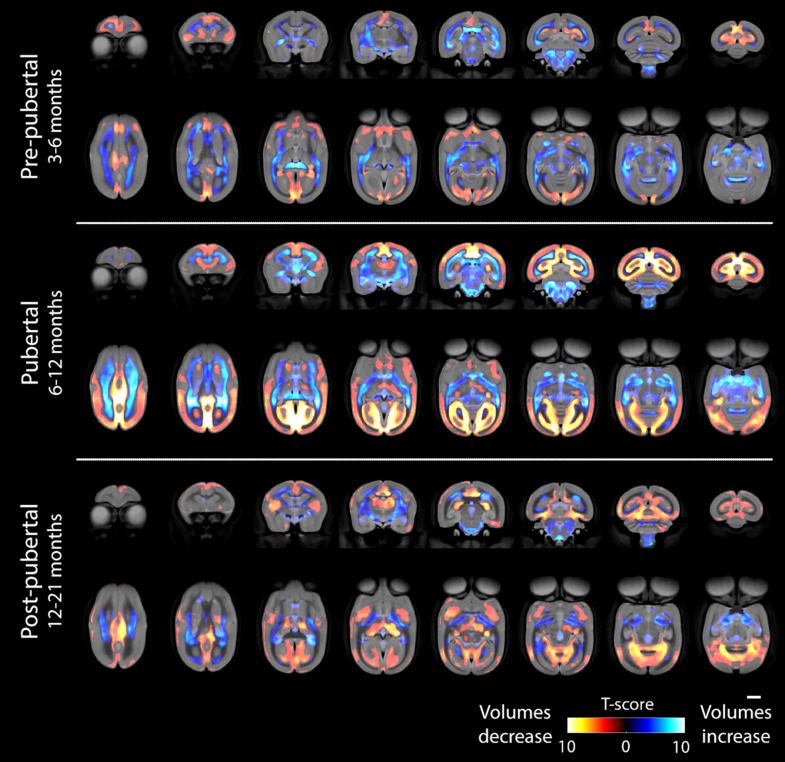
Figure 5.
Tensor-based morphometry results showing regions where volume increases or decreases between different stages are not explained by TIV changes. The color bar shows Student’s T-score and all changes shown are significant at an adjusted threshold for P < 0.05 (false-discovery rate; 2-tailed). The scale bar shows 5 mm. The top row of each timepoint shows coronal sections (slices progressing anterior to posterior) and the second row shows axial sections (superior to inferior).

