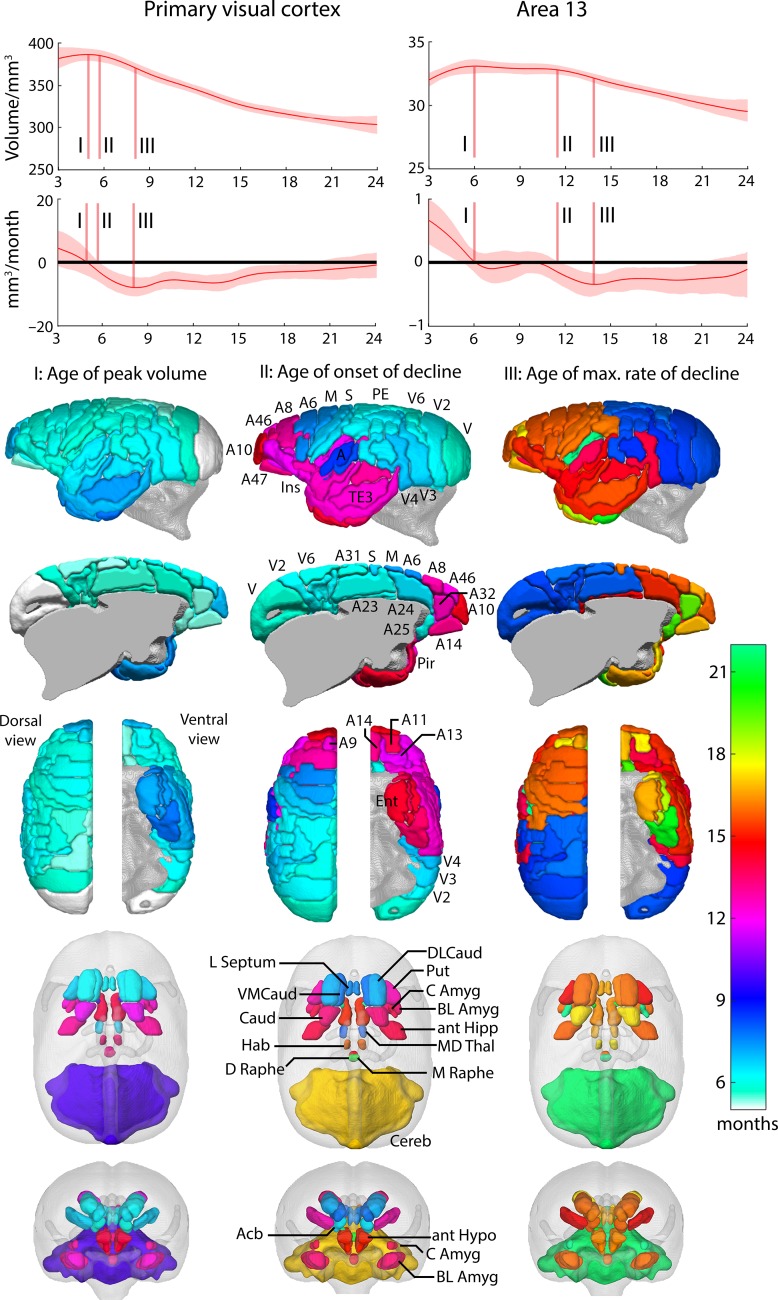
Figure 6.
Growth trajectories from fitted splines for primary visual cortex and orbitofrontal area 13 to illustrate milestones of development. The shaded region shows the 95% bootstrap confidence interval for the curve. The initial growth peak I) is the first maximum seen and the plateau end II) occurs when the 95% confidence interval for the rate of change no longer includes zero. The maximum rate of change following the growth peak defines stage III). These features can be seen most clearly in the first derivative curves, which display the rate of change of volume as a function of age. The first difference of note in the growth trajectories is the time at which each region reaches its greatest volume (milestone I); 4.98 months for V1 and 6 months for area 13. In V1, there is only a short period of approximately 1 month, before the onset of volume decline at 6 months (milestone II). In contrast, the peak volume of area 13 remains unchanged for approximately 6 months before starting to decline at 12 months. 3D reconstructions show the age at which these features occur for each cortical and subcortical region.

