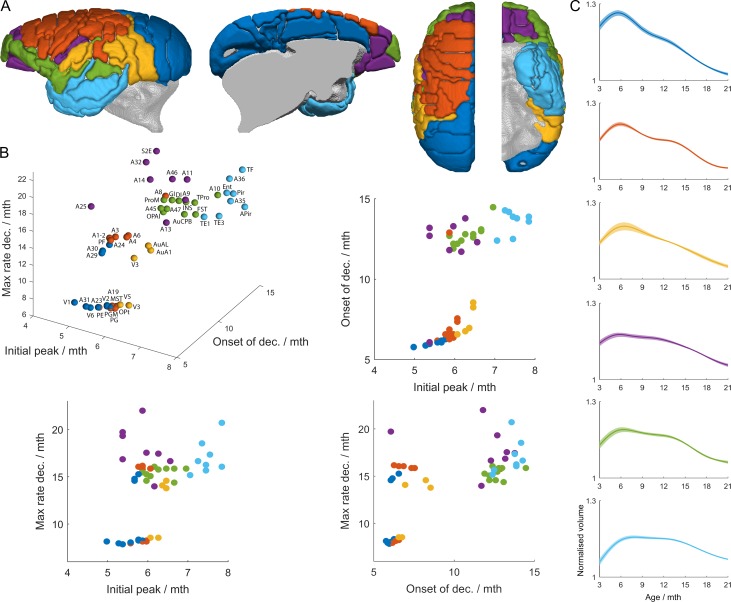
Figure 7.
Cortical clustering by trajectory. (A) shows 6 clusters found by k-means clustering. (B) The clusters are well-differentiated when considered in a 3D space formed by the milestone markers of Figure 6: the age of peak grey matter volume, the age at onset of grey matter volume decline, and the age at which the volume loss is a maximum. (C) the mean trajectory for each cluster is shown, with the shaded region indicating a 95% bootstrap confidence interval.

