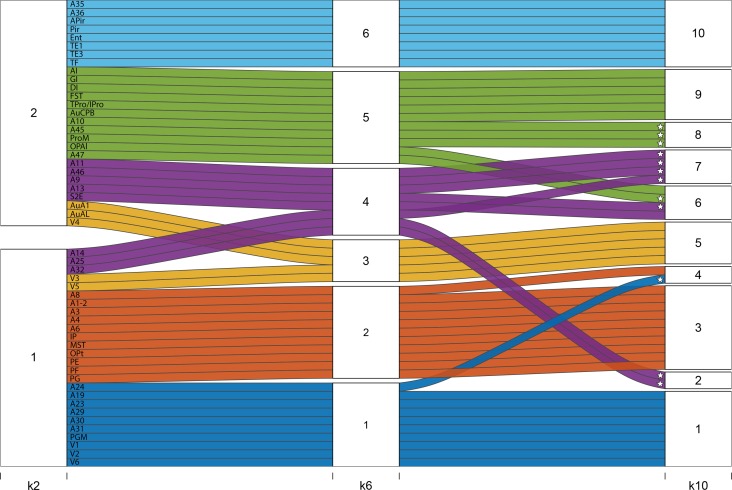
Figure 8.
Alluvial plot showing how clusters evolve from k = 2 to k = 6 and k = 10. At k = 2, the cortex is subdivided into one large predominantly prefronto-temporal family of areas (cluster 1: areas which have relatively delayed onset of peak growth, a more prolonged plateau period before the onset of volume decline, and a later age at maximum volume loss), and one large predominantly occipito-sensorimotor-parietal family of areas (cluster 2). Greatest heterogeneity in terms of distribution across clusters is seen among the prefrontal cortical structures (marked with *). Coloring depicts the k = 6 cluster solution. Pale blue (6): lateral and inferior temporal lobe. Green (5): ventrolateral PFC, polar, operculum, and insula cortices. Purple (4): orbitofrontal, dorsolateral and ventromedial prefrontal cortices. Yellow (3): auditory‐visual. Orange (2): somatomotor. Dark blue (1): visual and cingulate cortices: Note that the 2 prefrontal clusters (green, 5 and purple, 4) split into 3 additional clusters between k = 6 and k = 10 such that at k = 10 prefrontal/cingulate regions contribute to clusters 2, 4, 6, 7, and 8.

