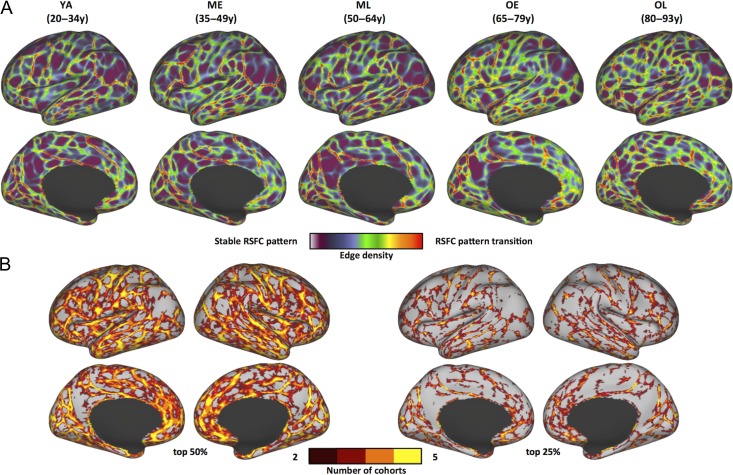
Figure 1.
RSFC-based boundary maps exhibit consistent boundaries across adult cohorts in Dataset 1. (A) RSFC boundary maps of 5 age cohorts: brighter colors indicate higher probability of RSFC pattern transition (i.e., a putative area boundary). Darker colors correspond to vertices with stable RSFC patterns (i.e., less likely to be area boundaries). Lateral and medial views of the left hemisphere are depicted. (B) Conjunction images depicting locations where stronger boundaries are consistently identified across cohorts. Each individual cohort map from (A) was thresholded to its top 50% (left) and 25% (right) boundary map values, binarized, and summed to reveal boundary features that are consistently identified across at least 2 and up to all 5 cohorts.

