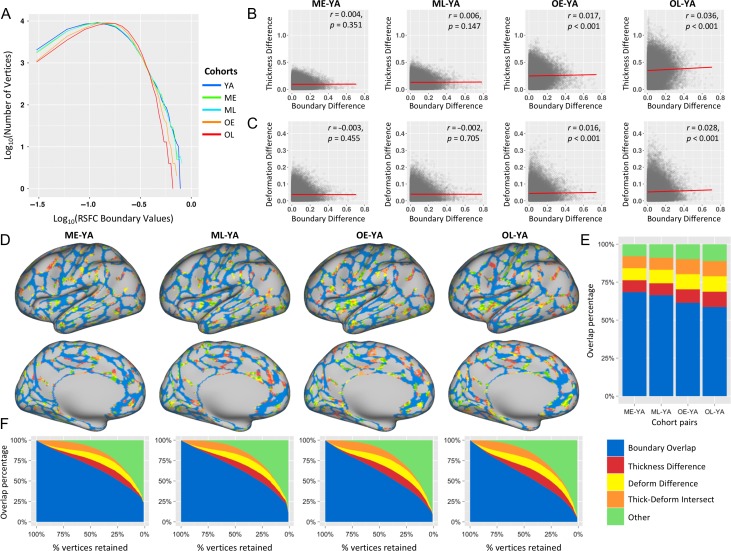
Figure 5.
Locations that exhibit boundary differences (non-YA cohorts vs. YA) largely coincide with locations that exhibit differences in cortical thickness and anatomical alignment across cohorts. (A) depicts the boundary value distribution of 5 cohorts; both x axis (boundary values) and y axis (number of vertices) were transformed using a logarithmic function for better visualization. Relative to the younger adult cohort, older adult cohorts (OE and OL) exhibit more vertices corresponding to medium probability RSFC boundary values, and less vertices exhibiting both higher (more likely to be area borders) and lower probability boundaries (more likely to be areas). (B) Boundary differences are significantly correlated with thickness differences in older cohorts (OE and OL), but not middle-age cohorts (ME and ML). (C) Boundary differences are significantly correlated with deformation differences for OE and OL, indicating that the vertices where there are greater boundary differences are also the locations of greater deformation differences for older cohorts (see Text S3 for details). (D) The similarity of the boundaries between each non-YA and YA cohorts were calculated based on spatial overlap across multiple thresholds of maps. At a threshold of 50%, the majority of the boundaries overlap with each other (vertices in blue), indicating high similarity between the 2 cohorts across the cortex. For the locations where boundaries were present in the YA cohort but absent in the non-YA cohorts, the majority of those vertices either exhibit between-cohort differences in cortical thickness (red), anatomical alignment (i.e., deformation; yellow), or both (orange). Vertices colored green correspond to locations where a boundary is present in the YA map but absent the non-YA map, and did not exhibit between-cohort differences in neither cortical thickness nor anatomical alignment. The distribution and proportion of these relationships is plotted in (E). While the majority of YA vertices exhibit overlap with non-YA cohort boundaries, the remainders are largely locations that exhibit differences in the deformation map and cortical thickness maps (all thresholded to retain the top 50% of vertices). (F) The correspondence between boundary overlaps and thickness/alignment differences exhibits similar patterns across thresholds (top 1–100% of possible vertex values, in steps of 1%).

