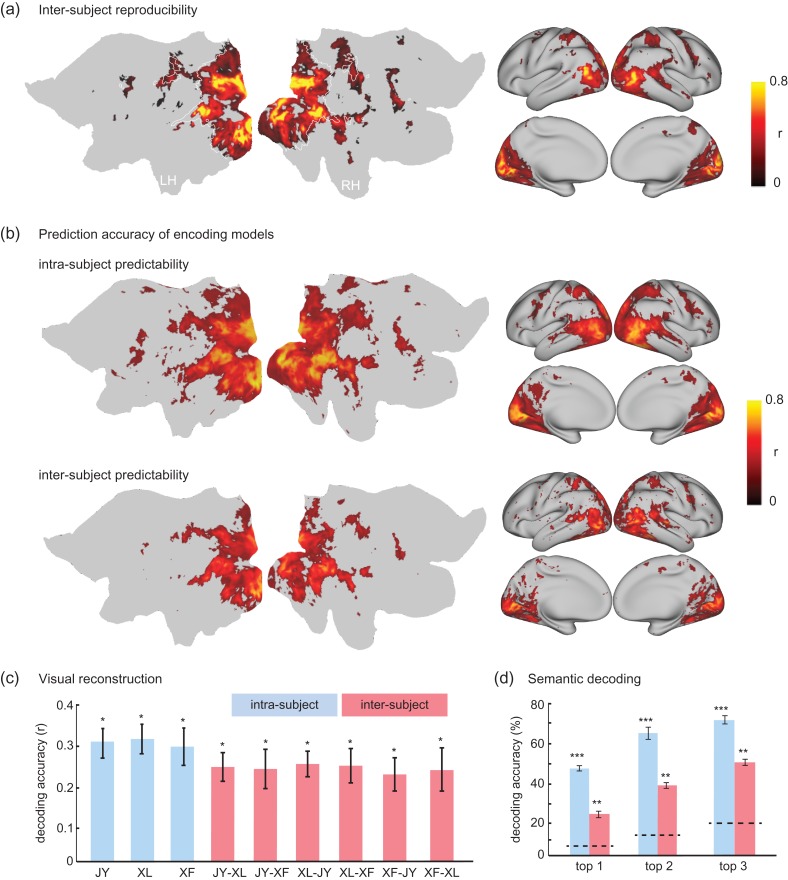
Figure 10.
Encoding and decoding within vs. across subjects. (a) Average inter-subject reproducibility of fMRI activity during natural stimuli. (b) Cortical response predictability with the encoding models trained and tested for the same subject (i.e., intra-subject encoding) or for different subjects (i.e., inter-subject encoding). (c) Accuracy of visual reconstruction by intra-subject (blue) vs. inter-subject (red) decoding for 1 testing movie. The y-axis indicates the spatial cross correlation between the fMRI-estimated and CNN-extracted feature maps for the first layer in the CNN. The x-axis shows multiple pairs of subjects (JY, XL, and XF). The first subject indicates the subject from whom the decoder was trained; the second subject indicates the subject for whom the decoder was tested. (d) Accuracy of categorization by intra-subject (blue) vs. inter-subject (red) decoding. The top-1, top-2 and top-3 accuracy indicates the percentage by which the true category is within the first, second, and third most probable categories predicted from fMRI, respectively. For both (c) and (d), the bar height indicates the average prediction accuracy; the error bar indicates the standard error of the mean; the dashed lines are chance levels. (*P < 10−4, **P < 10−10, ***P < 10−50). See Movie 2 for the reconstructed movie on the basis of inter-subject decoding.

