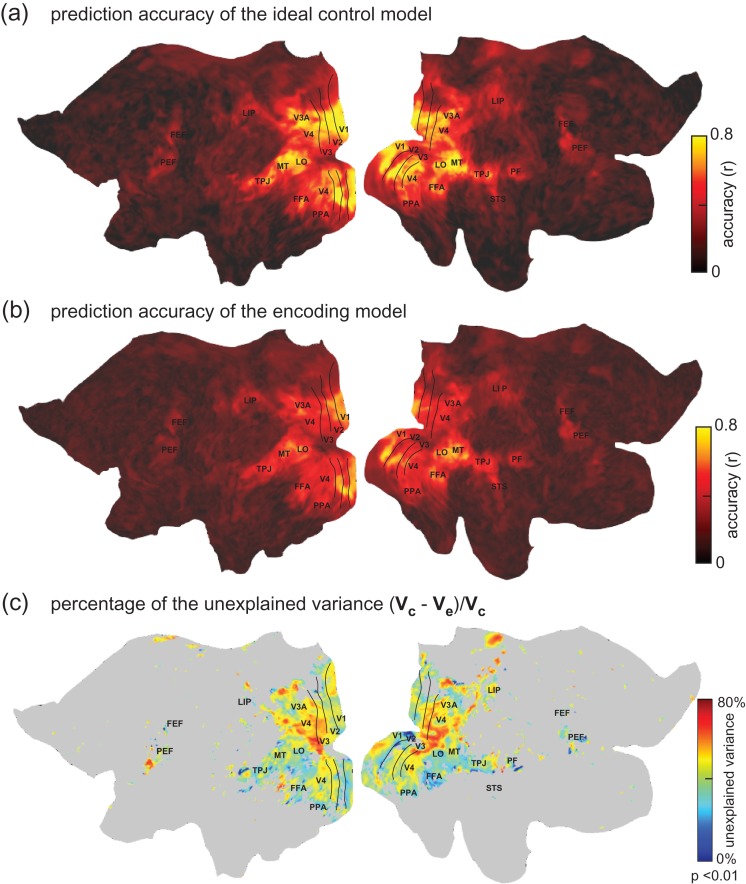
Figure 4.
Explained variance of the encoding models. (a) Prediction accuracy of the ideal control model (average across subjects). It defines the potentially explainable variance in the fMRI signal. (b) Prediction accuracy of the CNN-based encoding models (average across subjects). (c) The percentage of the explainable variance that is not explained by the encoding model. denotes the potentially explainable variance and denotes the variance explained by the encoding model. Note that this result was based on movie-evoked responses averaged over 5 repetitions of the testing movie, while the other 5 repetitions were used to define the ideally explainable variance. This was thus distinct from other figures, which were based on the responses averaged over all 10 repetitions of the testing movie.

