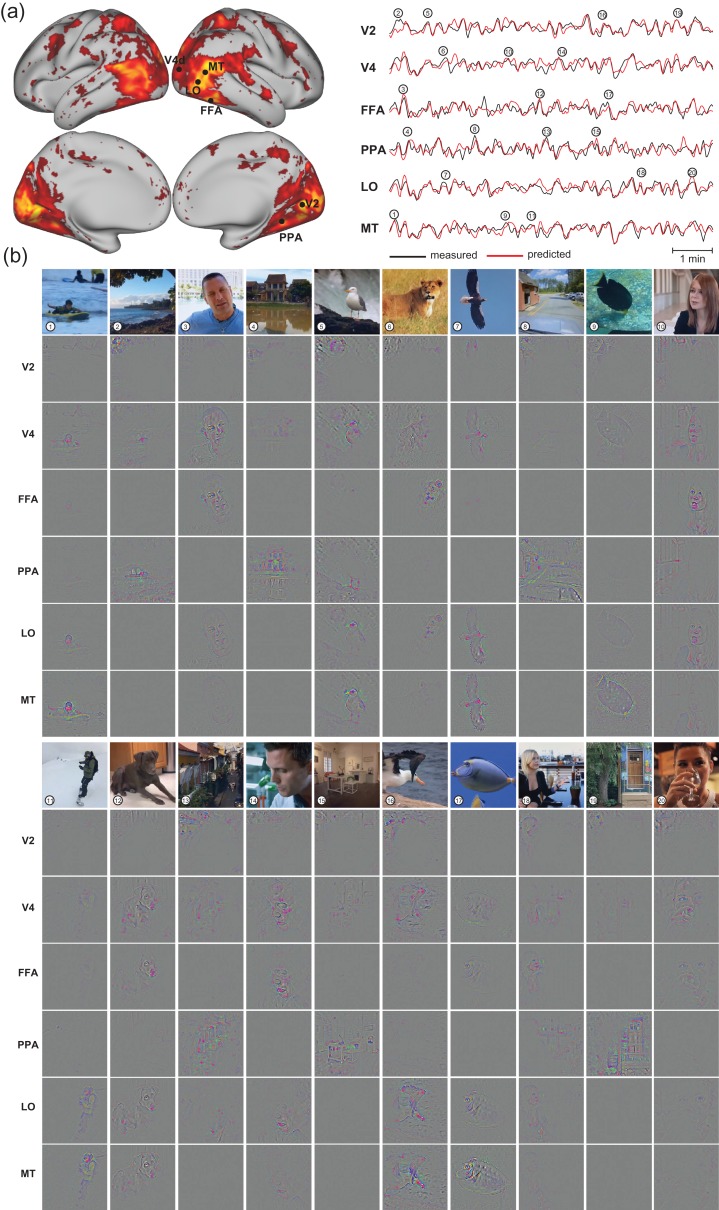
Figure 6.
Neural encoding models predict cortical responses and visualize functional representations at individual cortical locations. (a) Cortical predictability for subject JY, same as Fig. 3a. The measured (black) and predicted (red) response time series are also shown in comparison for 6 locations at V2, V4, LO, MT, PPA, and FFA. For each area, the selected location was the voxel within the area where the encoding models yielded the highest prediction accuracy during the testing movie (b) Visualizations of the 20 peak responses at each of the 6 locations shown in (a). The presented movie frames are shown in the top row, and the corresponding visualizations at 6 locations are shown in the following rows. The results are from Subject JY, see Supplementary Figs 6 and 7 for related results from other subjects.

