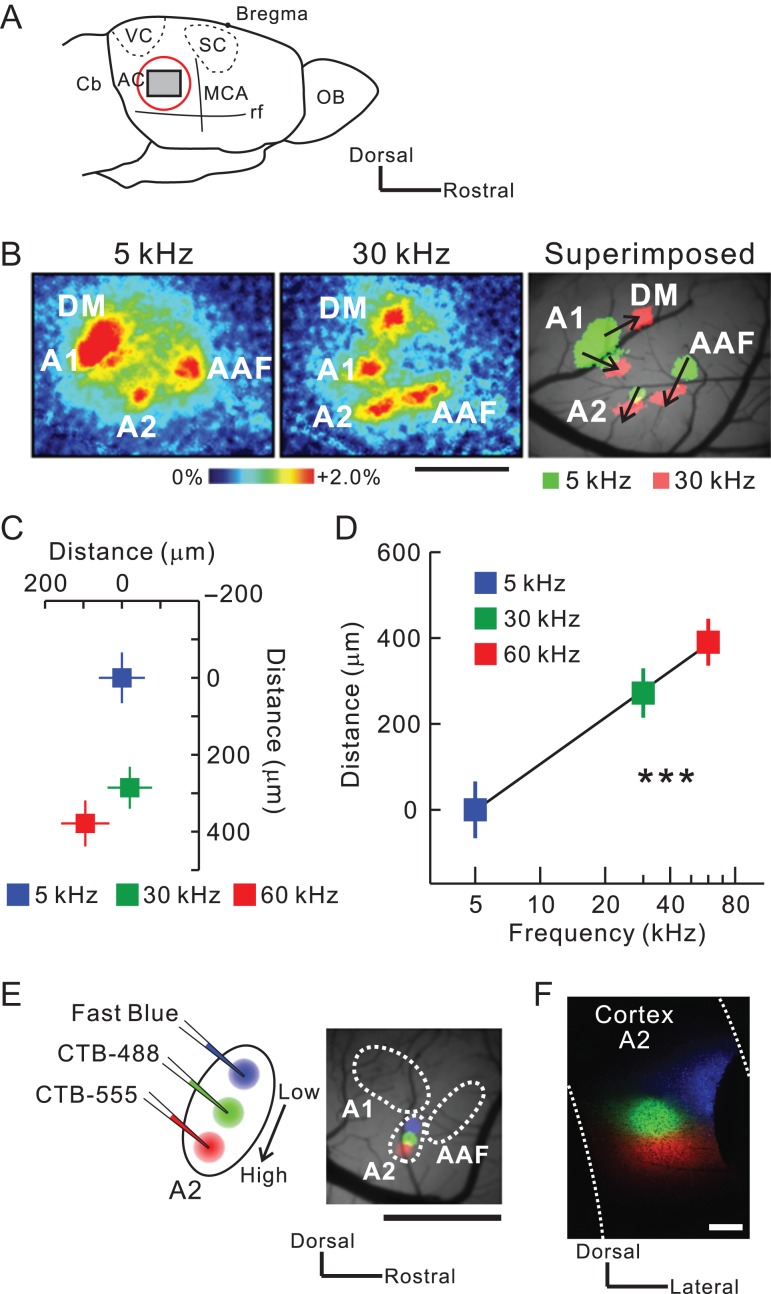
Figure 1.
Injection of retrograde tracers along the tonotopic map in mouse A2. (A) A schematic drawing of the mouse auditory cortex. AC, auditory cortex; Cb, cerebellum; MCA, medial cerebral artery; OB, olfactory bulb; rf, rhinal fissure; SC, somatosensory cortex; VC, visual cortex. (B) Typical images of tonal responses in the auditory cortex revealed using flavoprotein fluorescence imaging. Scale bar, 1 mm. (C) The tonotopic organization of A2. The averaged location of pixels with peak fluorescence is plotted in response to different frequencies. Significant shifts in response were observed from dorsal to ventral A2. Data were obtained from nine mice and superimposed based on the pixel of an A1 5-kHz response peak. (D) Correlation between frequencies and distances. Tonotopy was arranged along the axis connecting the peak pixels for 5-kHz and 60-kHz tones. r = 0.66, ***P < 0.001, Spearman’s test; n = 9 each. (E) Triple injection of Fast Blue (blue), CTB-488 (green), and CTB-555 (red) along the tonotopic gradient of A2. Tracer deposits on the brain surface ~30 min after injection are shown on the right. Scale bar, 1 mm. (F) Tracer deposits in A2 on a coronal slice. Scale bar, 200 μm. Data are shown in mean ± SEM.

