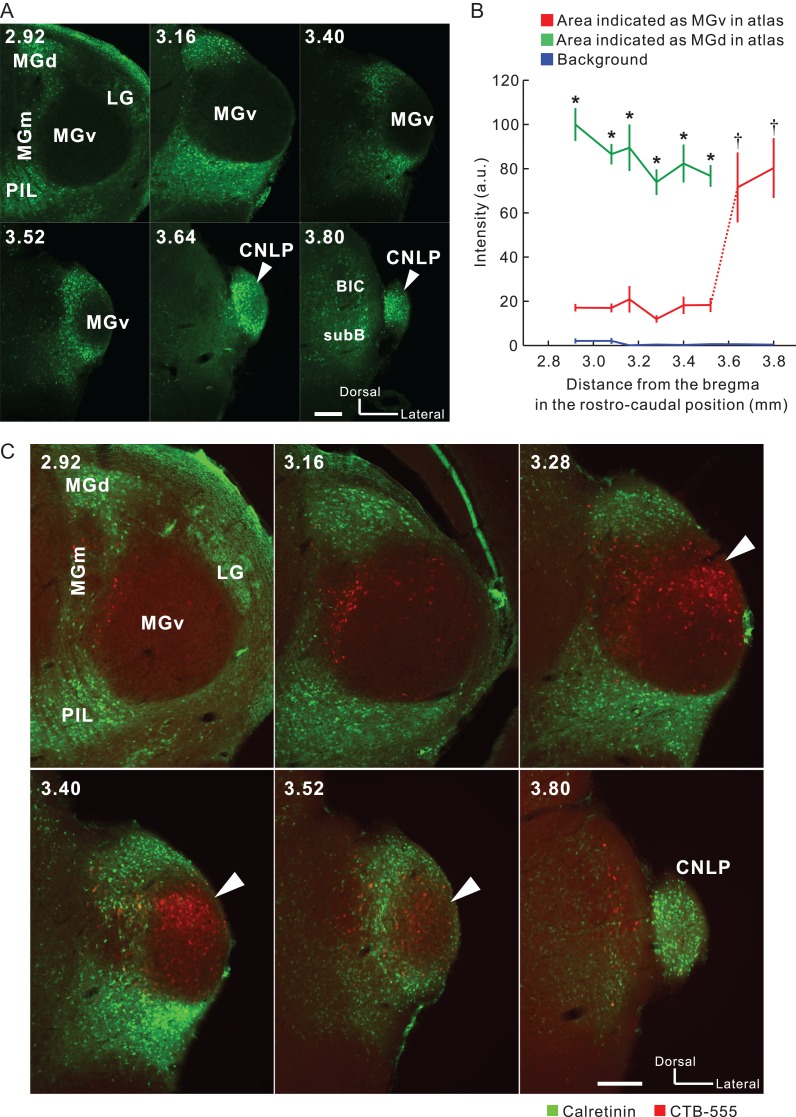
Figure 3.
Presence of MGv neurons that directly project to A2. (A) Calretinin immunolabeling in coronal slices of MGB. MGv lacked calretinin signals while non-lemniscal divisions specifically exhibited strong calretinin signals. White arrow heads indicate calretinin-positive signals in the region that is typically illustrated as MGv in existing atlases. The numbers in the upper left indicate the distance from the bregma. BIC, brachium inferior colliculus; CNLP, caudal non-lemniscal pole; SubB, subbrachial nucleus Scale bar, 200 μm. (B) Quantitative analysis of fluorescence intensity in coronal MGv, MGd, and the caudal pole of MGB in the rostrocaudal direction. Values of intensity were obtained by putting ~150- × 150-μm ROIs on 8-bit images. At every level rostral to 3.6 mm posterior to the bregma, intensity values were larger in MGd than in MGv (*P < 0.05, Mann–Whitney U-test). Intensity values in the caudal pole of MGB were similar to those in MGd, and larger than those in MGv rostral to 3.6 mm posterior to the bregma (†P < 0.01, one-way ANOVA followed by Tukey–Kramer post hoc test). The data were obtained from four animals. (C) Dual visualization of calretinin and CTB-555 injected into the middle frequency area of A2. White arrowheads indicate CTB-positive neurons densely localized within MGv. LG, lateral geniculate body; PIL, posterior intralaminar thalamic nucleus. Scale bar, 200 μm.

