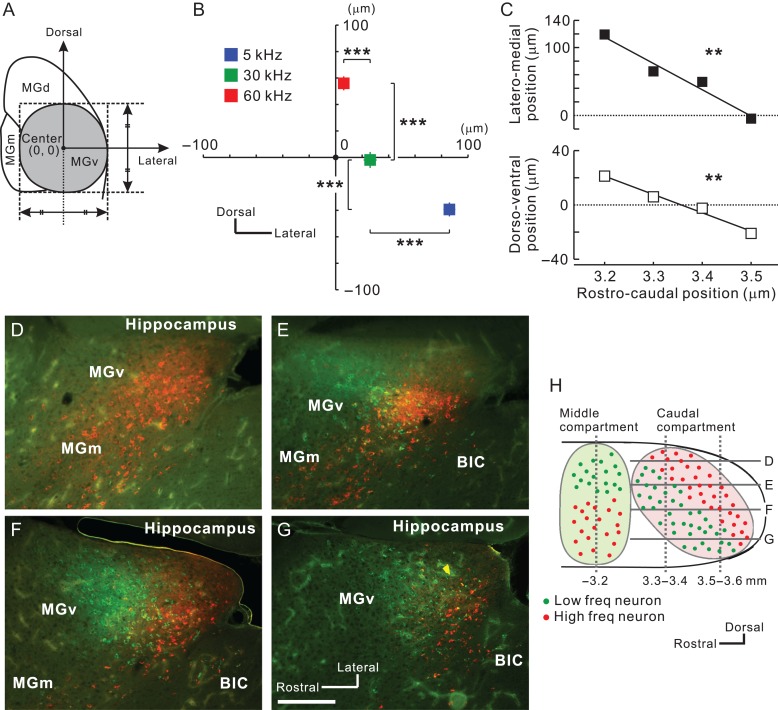
Figure 5.
Frequency-related gradient traveling ventrodorsally in caudal MGv. (A) Definition of the MGv center in each slice. (B) Average coordinates for projection neurons to A2 in slices 3.2–3.6 mm posterior to the bregma. The number of neurons was 1 268 for 5 kHz, 593 for 30 kHz, and 825 for 60 kHz. ***P < 0.001, Mann–Whitney U-test. (C) Lateromedial (top) and dorsoventral shift (bottom) of average coordinates for projection neurons to A2 in slices along 3.2–3.5 mm posterior to the bregma. Zero indicates the center of MGv obtained as shown in (A). **P < 0.01, Spearman’s test. (D–H). View of the caudal compartment of MGv. Horizontal distribution of MGv neurons projecting to low (green) and high (red) frequency areas in A2 are shown in (D–G). Scale bar, 200 μm. Approximate dorsoventral levels of each image are indicated in (H). Data are shown in mean ± SEM.

