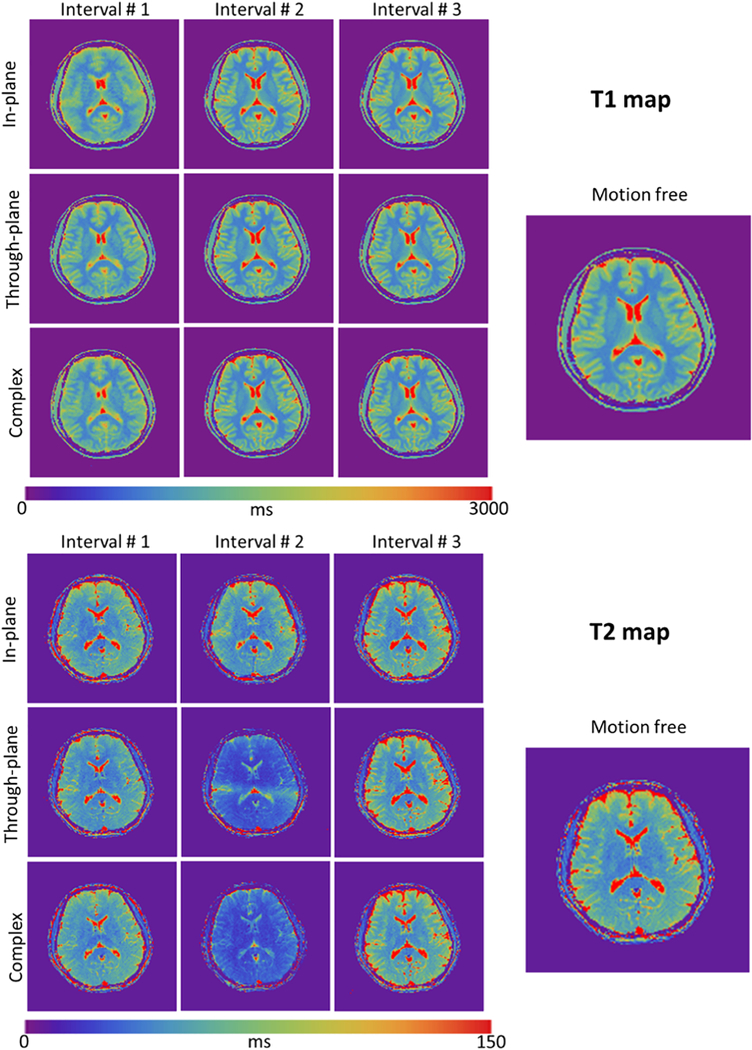
Figure 3:

T1 and T2 maps obtained with the radial FISP-MRF sequence (1.5×1.5×5mm3) in the presence of oscillating head movements. Columns correspond to different time intervals; rows correspond to different motion types. The morphological structures are well preserved in all T1 and T2 maps. Note that T2 values deviate from ground truth most notably in the middle column corresponding to the central time interval, especially for the cases of through-plane motion and complex motion.
