Figure 5:

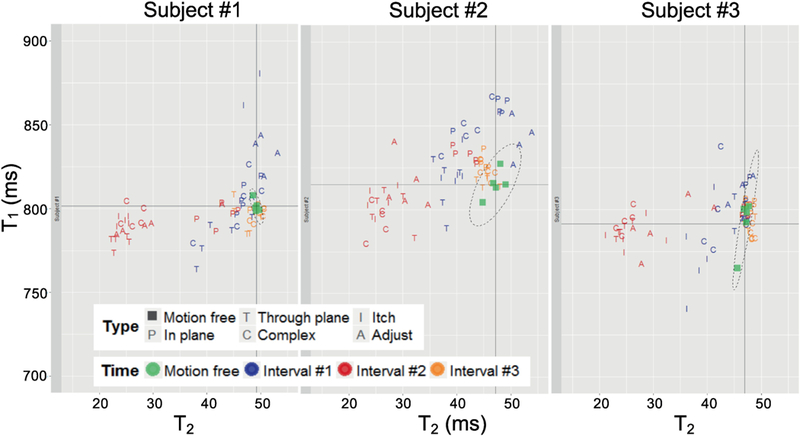
Scatter plots of T1 and T2 values measured in the prefrontal white matter of three subjects. Values were averaged over an ROI (90 pixels) to get the corresponding T1 and T2 values. Each scan was repeated five times.

Scatter plots of T1 and T2 values measured in the prefrontal white matter of three subjects. Values were averaged over an ROI (90 pixels) to get the corresponding T1 and T2 values. Each scan was repeated five times.