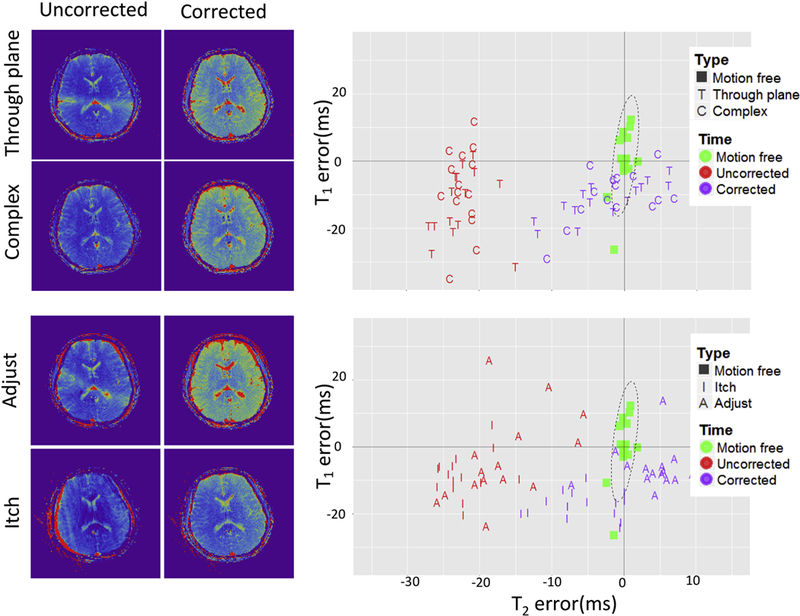
Figure 6:

The results obtained by leveraging data redundancy only to correct motion artifacts. On the left side is the T2 maps derived from uncorrected and corrected data are shown. On the right side the scatter plots of T1/T2 error are shown (Same ROI as in Fig. 5).
