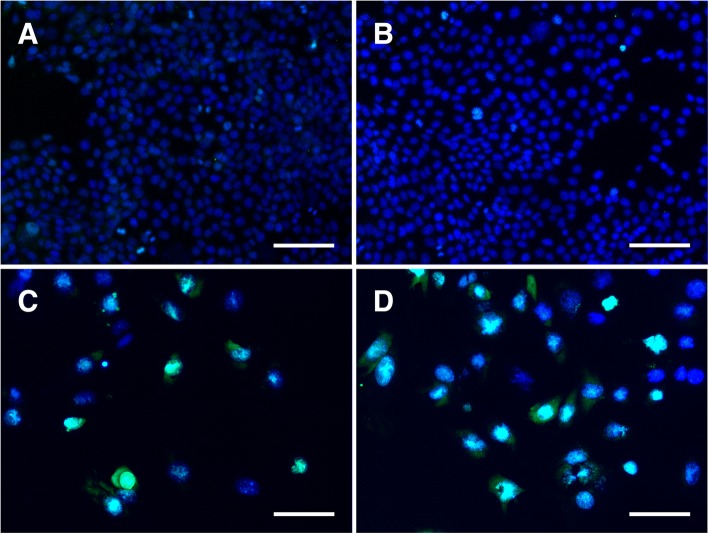
Fig. 5.
LIVE/DEAD fluorescence assay demonstrates little to no cell death in untreated 4T1 cells (a) and in cells treated with NALG (b). Green channel signal intensity (dead cell stain) is strong in a large amount of the cells treated with 0.078 μg/mL DOX (c) and 0.20 μg/mL NALG-DOX (d), indicating cell death. Scale bars indicate 100 μm. Concentrations indicate amount of DOX, either free or in particle. NALG dosing in (b) at same particle density as in NALG-DOX

