Figure 1.

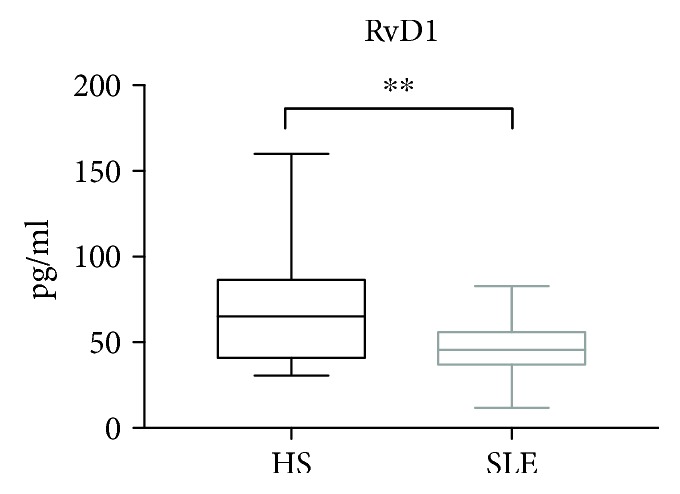
Levels of resolvin D1 (RvD1) in plasma from SLE patients (n = 30) and matched HSs (n = 30). Data are expressed as pg/ml, median (horizontal bar) with 25th and 75th percentile (boxes), and minimum and maximum (bars) (∗∗p = 0.0043).

Levels of resolvin D1 (RvD1) in plasma from SLE patients (n = 30) and matched HSs (n = 30). Data are expressed as pg/ml, median (horizontal bar) with 25th and 75th percentile (boxes), and minimum and maximum (bars) (∗∗p = 0.0043).