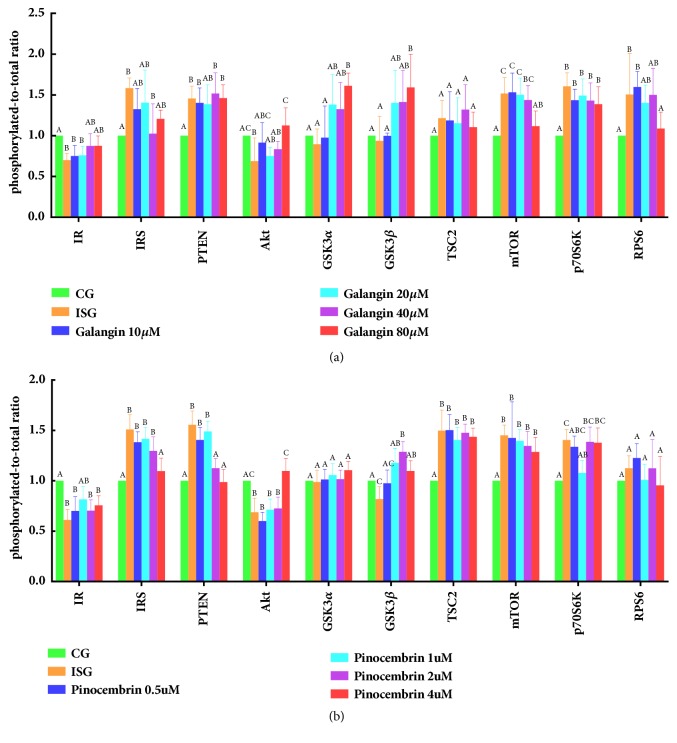
Figure 4.
Effect of galangin and pinocembrin on the phosphorylation levels of key proteins of Akt/mTOR signaling pathway in insulin-resistant HepG2 cells. Note: (1) the CG is control groups; the ISG is insulin stimulation groups; (a) the 10 to 80 is concentration of galangin; (b) the 0.5 to 4 is concentration of pinocembrin. (2) The x-axis is the name of the key protein of Akt/mTOR signaling pathway. The y-axis is the phosphorylation level of the key protein of Akt/mTOR signaling pathway. (3) Values are means ± SEM from six separate determinations. Values with different letters (A–C) in the same column are significantly different from each other (p < 0.05).

