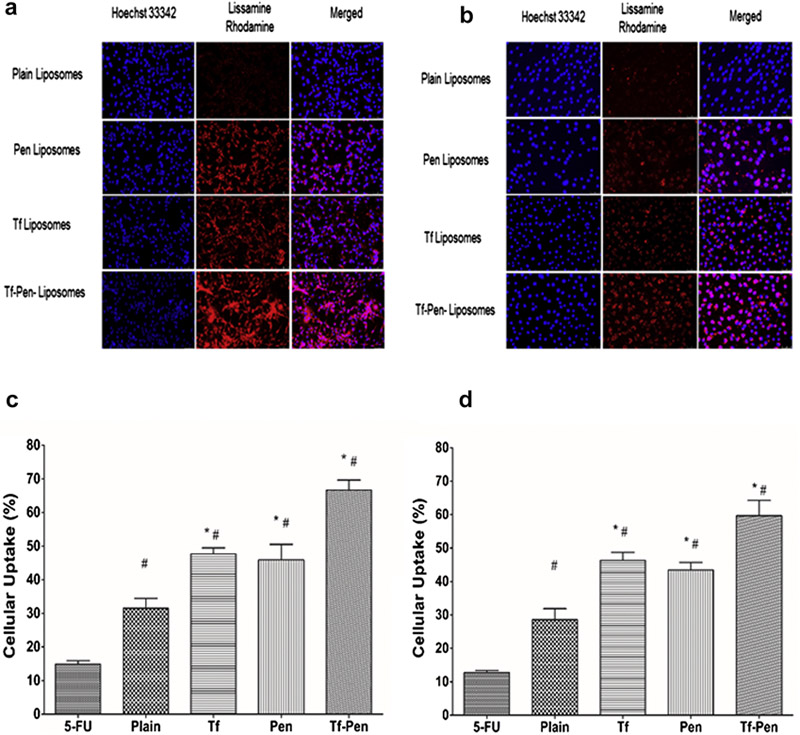
Figure 4.
Fluorescence microscopic images (10× magnification) showed uptake of lissamine rhodamine labeled liposomes (excitation/emission wavelengths: 560/583 nm) in A) U87 and B) bEnd.3 cells after 2 h incubation. The nuclei of the cells were stained with Hoechst 33342 (excitation/emission wavelengths: 350/461 nm). The images show overlap of lissamine rhodamine labeled liposomes (red) and nuclei of the cells (blue). Graphs represent cellular uptake of 5-FU encapsulated liposomes in C) U87 and D) bEnd.3 cells after 2 h incubation. Data represented as mean ± SD, (n=4). Statistically significant (p < 0.05) differences is shown as (*) with plain liposomes and (#) with 5-FU.

