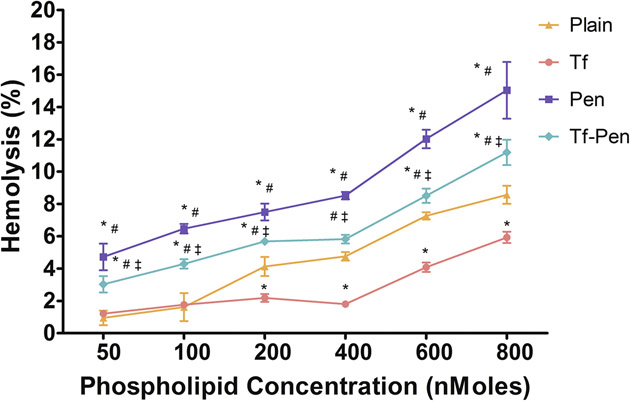
Figure 7.
Hemolytic activity (%) of various liposomes. Red blood cells were exposed to different liposomes at varying concentrations. PBS and triton X-100 were used as positive and negative controls, respectively. Up to 10% hemolysis was considered non-toxic. Statistically significant (p < 0.05) differences is shown as (*) with plain liposomes, (#) with Tf-liposomes, and (‡) with Pen-liposomes. The data is represented as mean ± S.D. (n=4).

