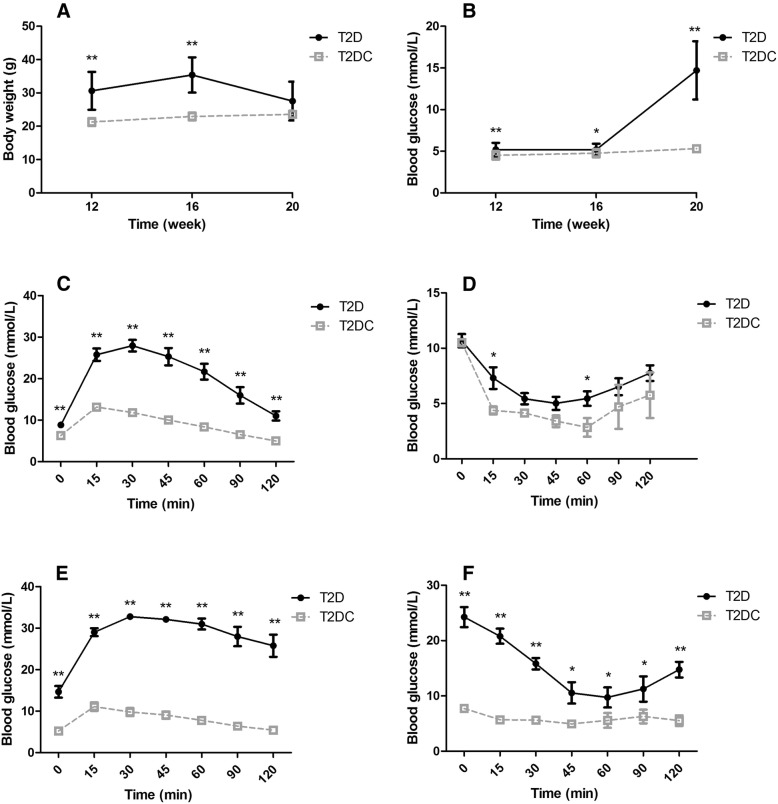
Fig. 1.
A sketch of the T2D mouse model. (a) Body weight and (b) blood glucose were significantly increased (P<0.05) in T2D mice compared to the T2 DC group. (c) Glucose tolerance test (GTT) and (d) Insulin resistance test (ITT) at 16 weeks in T2D and T2 DC groups. T2D mice showed glucose intolerance and insulin resistance. After injection of STZ, at 20 weeks, glucose tolerance test (GTT) (e) and insulin resistance test (ITT) (f) are also seen in T2D mice. T2D mice showed persistent glucose intolerance and insulin resistance

