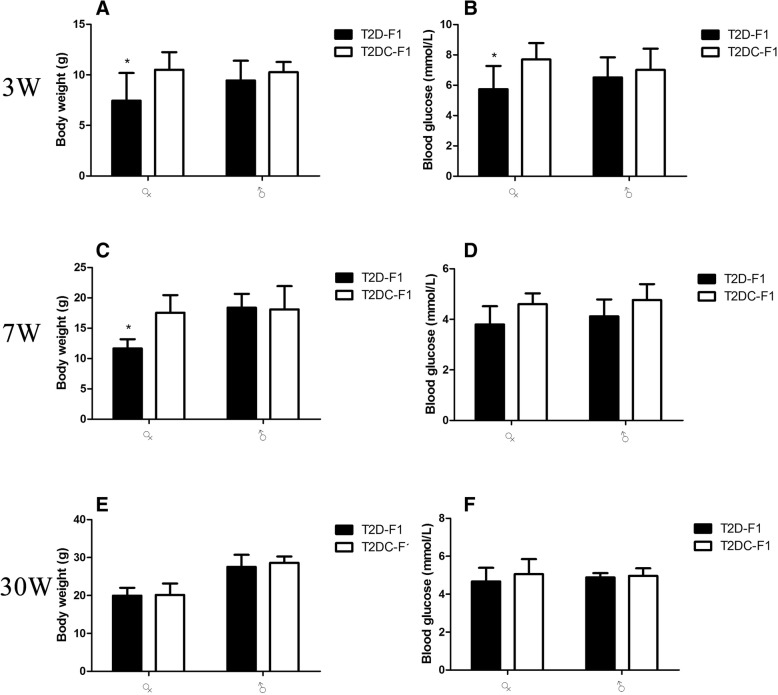
Fig. 3.
T2D-F1 body weight and blood glucose. Female T2D-F1 group had significantly lower (a) body weight and (b) blood glucose (P<0.05) at weaning. At 7 weeks, female T2D-F1 mice showed significantly lower (c) body weight compared to female T2 DC-F1 mice. (d) Blood glucose in the two groups showed no difference in male\female mice. At 30 weeks, there were no differences in body weight (e), and blood glucose (f) between the two groups

