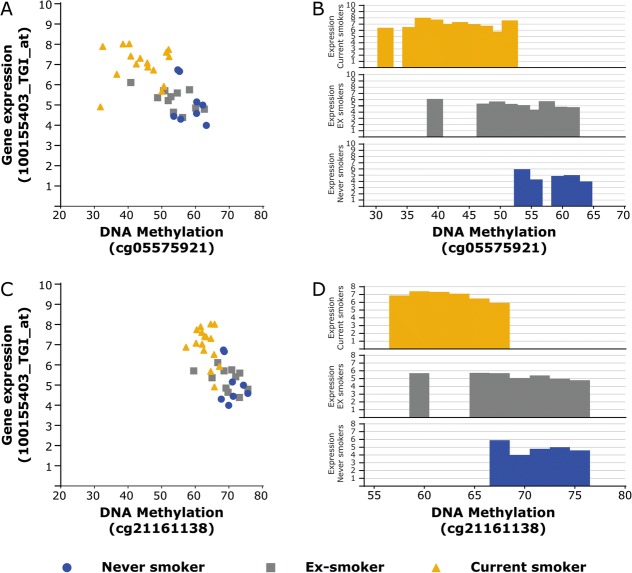
Fig. 4.
Association between DNA methylation levels and gene expression of AHRR in lung tissue. a and c) DNA methylation levels are presented on the X-axis and the normalized gene expression levels are shown on the Y-axis. Blue circles = never smokers, gray squares = ex-smokers and yellow triangles = current smoker. b and d) DNA methylation levels are presented on the X-axis and the average of the normalized gene expression levels distributed per 2% DNA methylation are shown on the Y-axis. The upper part with yellow bars represents current smokers, the middle part with gray bars represents ex-smokers and the lower part with blue bars represent never smokers

