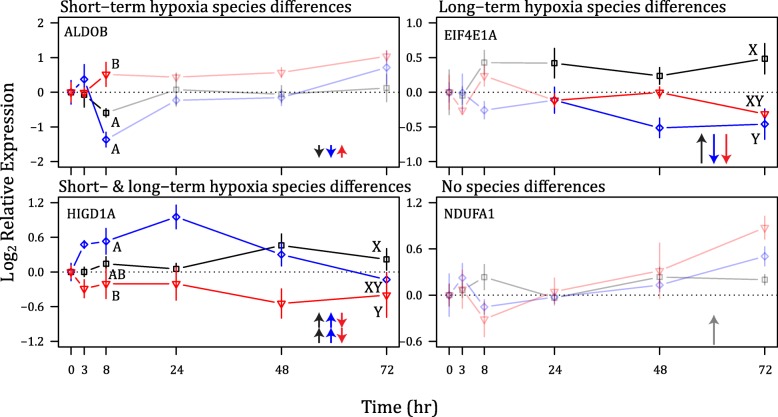
Fig. 1.
Transcript levels of a representative gene for each category of the transcription response. Smoothhead sculpin (black line, square symbol), sailfin sculpin (blue line, diamond symbol) and Pacific staghorn sculpin (red line, inverted triangle symbol) were exposed to 72 h of hypoxia. Opaque lines represent the portion of the time-course that is different among the species, while transparent lines represent the portion of the time-course for which transcription does not differ among the species. Letters represent significant difference in transcript levels between species (A-B represent difference in the short term hypoxia and X-Y represent differences in the long term hypoxia). Full gene names are as follows: fructose-bisphosphate aldolase B (ALDOB), eukaryotic translation initiation factor 4E-1A (EIF4E1A), HIG1 domain family member 1A (HIGD1A) and NADH dehydrogenase 1 alpha subcomplex subunit 1 (NDUFA1)

