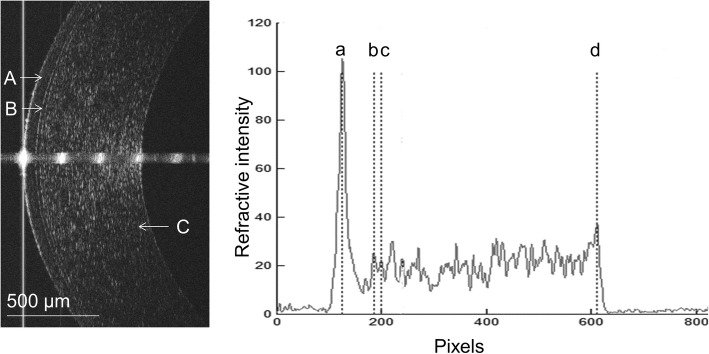
Fig. 1.
Optical coherence tomography (OCT) image of one 29-year-old subject and longitudinal reflectivity profile. Left: OCT image of the cornea center at baseline. a: Epithelium; b: Bowman’s layer; c: Stroma. Right: Longitudinal reflectivity profile after removing the strong reflectivity at the center. The distance between peaks a and b was the thickness of the epithelium; the distance between peaks b and c was the thickness of Bowman’s layer; the distance between peaks c and d was the thickness of stroma; and the distance between peaks a and d was the total corneal thickness

