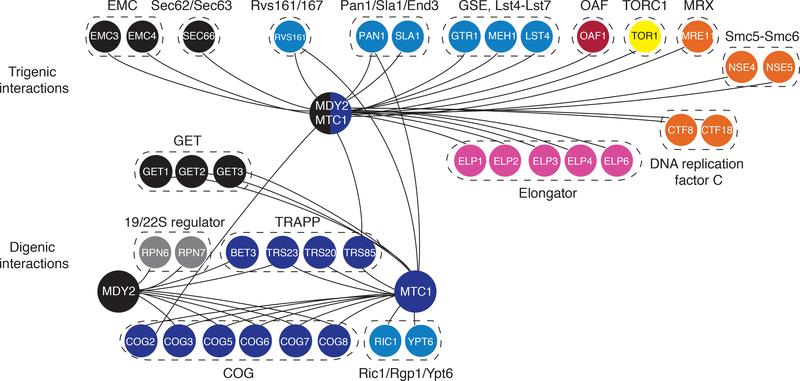
Fig. 3. MDY2-MTC1 – a hub on the trigenic interaction network.
Representative digenic interactions are highlighted for MDY2 and MTC1 single mutant query genes, and representative trigenic interactions are shown for the MDY2-MTC1 double mutant query. The network was visualized using Cytoscape (63). Genes were chosen from representative protein complexes (8) in which ≥ 50% of members on the diagnostic array display genetic interactions. Negative genetic interactions, ε or τ < −0.08, p < 0.05, are depicted. All of the digenic and trigenic interactions displayed have been confirmed by tetrad analysis. Nodes are color coded based on their biological roles. Nodes are labeled with gene names and genes are grouped according to specific protein complexes.

