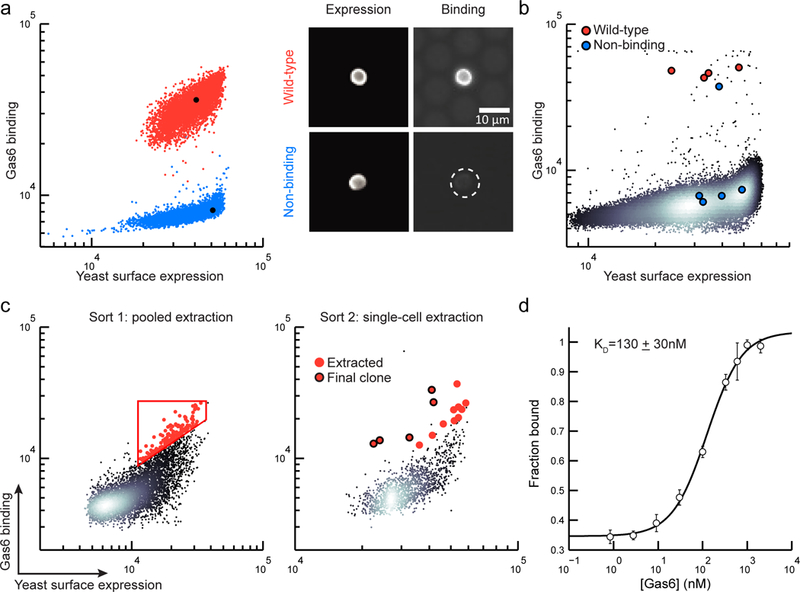
Figure 2.

High-throughput screening of binding proteins using μSCALE. (a) Two-parameter scatter plots (left), where each dot represents a microcapillary (n = 5000 microcapillaries per condition), and microscope images (right) of the WT Axl (red) and the non-binding Axl variant (blue). (b) A scatter plot from a representative mock library screen (ratio of WT:non-binding variant = 1:10,000, n=147,849 microcapillaries). Extracted clones identified as WT Axl (red dots) and non-binding Axl variants (blue dots). (c) Two rounds of μSCALE screening of a yeast surface-displayed naïve scFv library for Gas6 binders. Sort 1: automated pooled extraction of 143 capillaries with a user-drawn gate (left), Sort 2: manual single-cell extraction of 15 capillaries (right). Red dots, extracted clones; Red dots with black outline, clones with highest binding to Gas6. (d) Gas6 binding curve of the yeast-displayed scFv identified by μSCALE, represented as the fraction of Gas6 bound versus the concentration added. Error bars correspond to the standard deviation of three technical replicates.
