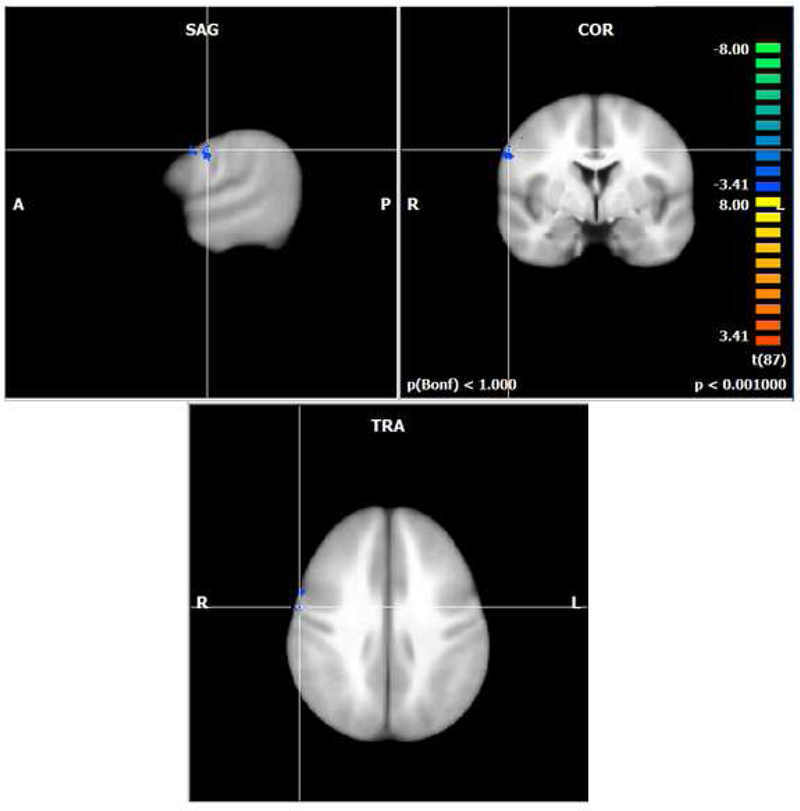
Figure 2.

Activation map for hypothesized increase in dopamine across groups during the working memory load coditions of the N-back task (p < .001; cluster corrected k=8). Blue colors represent decreasing activation as the hypothesized dopamine level increased in the right precentral gyrus (BA 6). Greatest hypothesized dopamine in the Met/Met high estradiol group and lowest hypothesized dopamine in the Val/Val low estradiol group.
