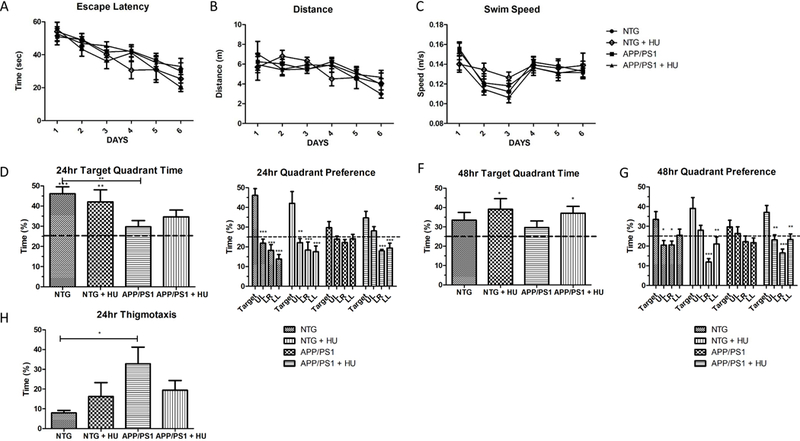
Figure 8. Morris water maze cohort 2.

HU-treatment improved spatial reference memory in 10 to 13-month-old APP/PS1 mice. A) Latency to reach the hidden platform. B) Distance to reach the hidden platform. C) Average swim speed. There was no significant difference in escape latency, distance to find the platform, or swim speed between the four groups of mice during the six-day training period (2-way RM-ANOVA p = 0.533, p = 0.973, and p = 0.601, respectively). D) 24-hour probe trial time in target quadrant. NTG and HU-treated NTG mice spent significantly more time in the target quadrant compared to the 25% chance level (One-way ANOVA p = 0.0003, post-hoc Bonferroni analyses pNTG < 0.001 and pNTG + HU < 0.01). NTG mice spent significantly more time than APP/PS1 mice in the target quadrant (One-way ANOVA p = 0.021, post-hoc Bonferroni analyses NTG vs APP/PS1 **p < 0.01). E) 24-hour probe trial quadrant preference. NTG control, HU-treated NTG control, and HU-treated APP/PS1 mice spent significantly more time in the upper right (UR) target quadrant than in non-target quadrants (UL = upper left, LR = lower right, LL = lower left; one-way ANOVAs within groups NTG, NTG + HU, and APP/PS1 + HU p = 0.0001, pAPP/PS1 = 0.089, post –hoc Dunnett’s multiple comparison tests *p < 0.05, **p < 0.01, ***p < 0.001). F) 48-hour probe trial time in target quadrant. HU-treated NTG mice and HU-treated APP/PS1 mice spent significantly more time in the target quadrant compared to the 25% chance level (One-way ANOVA p = 0.023, post-hoc Bonferroni analyses p < 0.05). G) 48-hour probe trial quadrant preference. NTG control, HUtreated NTG control, and HU-treated APP/PS1 mice spent significantly more time in the upper right target quadrant than in the non-target quadrants (One-way ANOVA within group pNTG = 0.012, pNTG + HU = 0.001, pAPP/PS1 = 0.221, pAPP/PS1 + HU = 0.001, post –hoc Dunnett’s multiple comparison tests *p < 0.05, **p < 0.01, ***p < 0.001). H) 24-hr probe thigmotaxis. APP/PS1 mice exhibited significantly more thigmotaxis than NTG mice (One way ANOVA p = 0.064, post-hoc Bonferroni analyses NTG vs APP/PS1 p < 0.05). NTG n = 9, NTG + HU n = 8, APP/PS1 n = 13, APP/PS1 + HU n = 13. Bars = SEM.
