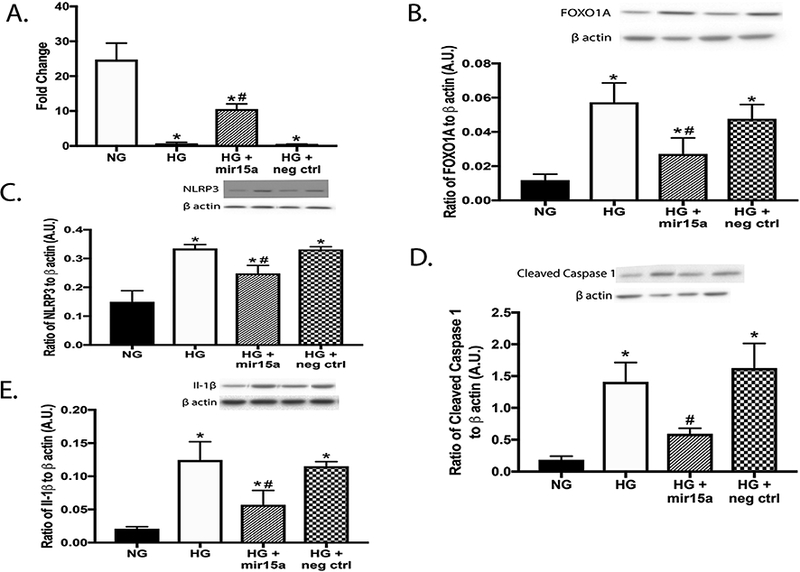
Fig. 3.

Panel A shows qPCR results of miR15a expression levels in REC grown in normal glucose (NG) and high glucose (HG). Some REC grown in HG were transfected with miR15a mimic or a negative control. Panel B-E is Western blotting for the ratio of Foxo1 levels (B), NLRP3 (C), cleaved caspase 1 (D) and IL-1β (E) to β actin. *P < 0.05 vs. NG, #P < 0.05 vs. HG. N = 3–5 for all groups.
