
Figure 5.
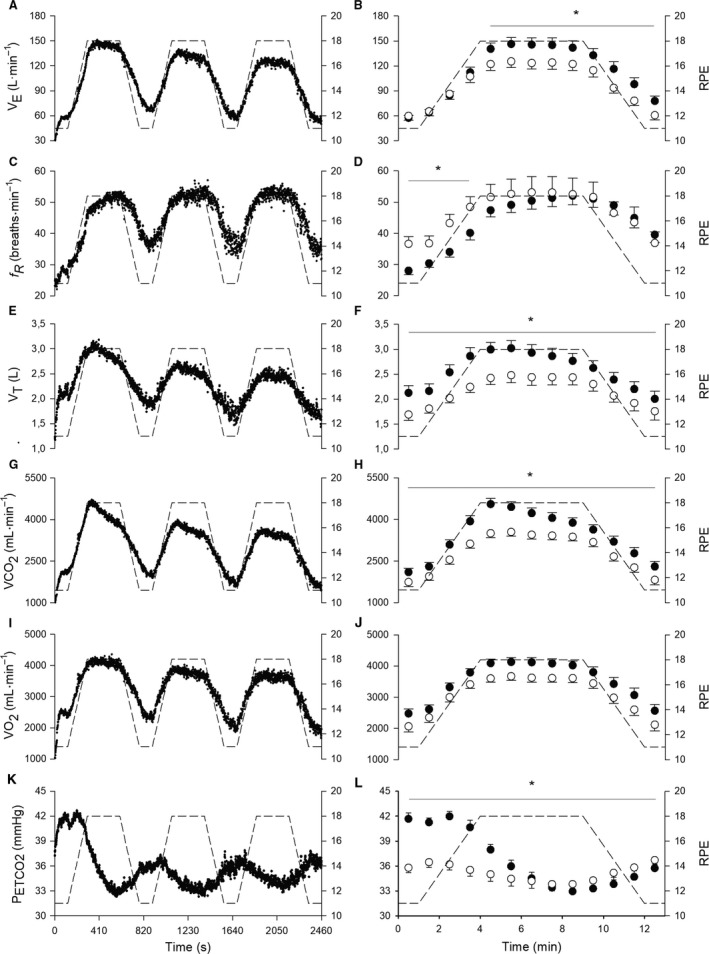
In the left panels, group mean response of second‐by‐second data for (A), fR (C), V T (E), (G), (I) and PETCO 2 (K) during the entire trapezoidal test. The RPE required by the test is depicted in dashed lines. In the right panels, 60‐sec average values of (B), fR (D), V T (F), (H), (J) and PETCO 2 (L) for the first (filled circles) and the third (open circles) trapezoidal bouts. When a significant bout × time interaction was found, * depicts significant simple main effect of bout (P < 0.05).