
Figure 2. Activity Regulates Cell Death of Specific CGE-Derived Interneuron Subtypes in the Developing Cortex.
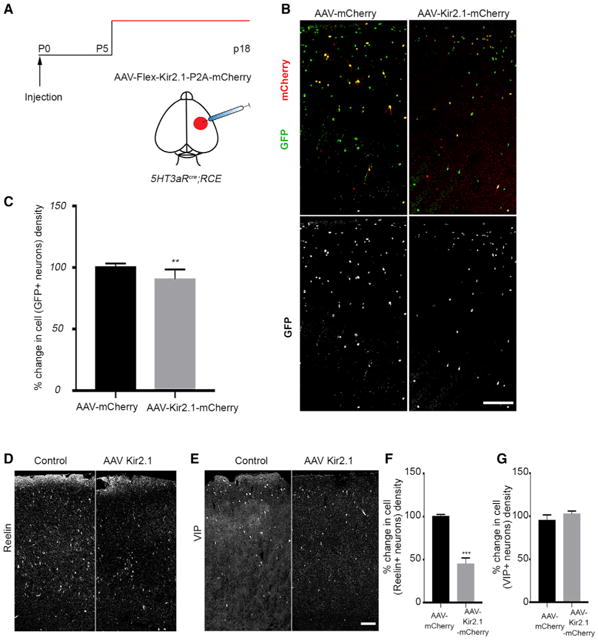
(A) Schematic representation of the experimental strategy.
(B) Representative section of the cortex with AAV injections. Left: a coronal section from a 5HT3aRcre;RCE brain injected with AAV-flex-mCherry. Right: 5HT3aRcre;RCE brain section injected with AAV-flex-Kir2.1-P2A-mCherry.
(C) Quantification of the percent change in cell density of GFP+ interneurons in the AAV-Kir2.1-mCherry-injected hemisphere compared with the control (p = 0.0057, n ≥ 3).
(D) Representative images showing coronal sections from 5HT3aRcre;RCE brains injected with control (left) and AAV-flex-Kir2.1-P2A-mCherry virus (right) immunostained for Reelin.
(E) Representative images showing coronal sections from 5HT3aRcre;RCE brains injected with control (left) and AAV-flex-Kir2.1-P2A-mCherry virus (right)immunostained for VIP.
(F) Quantification of the percent change in cell density of Reelin+ interneurons in AAV-Kir2.1-mCherry-injected brain compared with the control (mean ± SEM, p = 0.0.006, unpaired t test, n ≥ 3).
(G) Quantification of the percent change in cell density of VIP+ interneurons in AAV-Kir2.1-mCherry-injected brain compared with the control (mean ± SEM, p = 0.1135, unpaired t test, n ≥ 3). Scale bars, 100 μm. See also Figures S2 and S3.