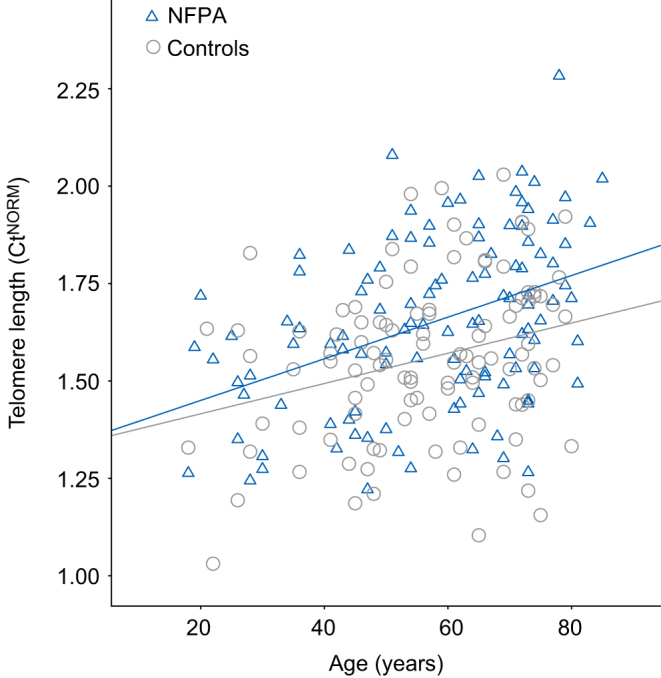
Figure 1.

Shorter telomere length in NFPA patients. Correlation of adjusted pPCR values (Ct) with age in NFPA patients (n = 115) and controls (n = 106). Note, higher Cts are indicative of shorter telomeres. Pearson correlation: r = 0.404, P ≤ 0.001 (NFPA) and r = 0.282, P = 0.003 (controls). Ct, threshold cycle.

 This work is licensed under a