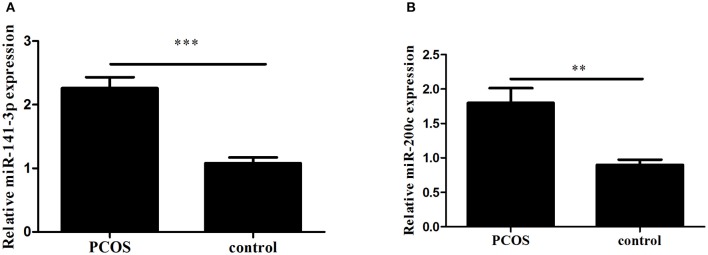
Figure 1.
The expression of miR-141 and miR-200c in Polycystic Ovary Syndrome (PCOS) and control groups. Results are showed as the mean of (miRNAs of interest/U6) ± SD. (A) Expression of miR-141. (B) Expression of miR-200c. ***p < 0.001, **p = 0.002. PCOS women, n = 62; control women, n = 61. The groups were compared by Student t-test to determine statistical significance, A p-value < 0.05 was considered statistically significant.

