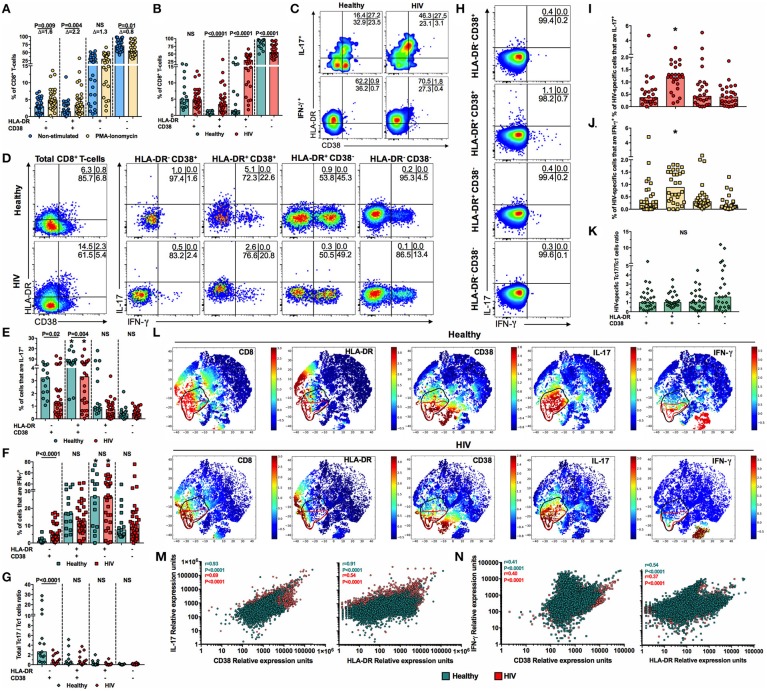
Figure 3.
Low frequency of activated Tc17 cells in PLWH. (A) Frequency of HLA-DR- and/or CD38-expressing non-stimulated and PMA-ionomycin-stimulated CD8+ T-cells from PLWH. The Δ of the PMA-ionomycin/non-stimulated cells frequency is shown at the top. The P-value of the Wilcoxon test is shown. (B) Frequency of HLA-DR- and/or CD38-expressing PMA-ionomycin-stimulated CD8+ T-cells from healthy individuals and PLWH. (C) Expression of HLA-DR and CD38 in IL-17+ and IFN-γ+ CD8+ T-cells after PMA-ionomycin stimulation in a representative healthy individual and patient living with HIV. (D) Representative pseudocolor plots of the expression of IL-17 and IFN-γ in HLA-DR/CD38-expressing CD8+ T-cells after PMA-ionomycin stimulation in a representative healthy individual and patient living with HIV. (E,F) Frequency of IL-17+ (E) and IFN-γ+ (F) cells among HLA-DR- and/or CD38-expressing PMA-ionomycin-stimulated CD8+ T-cells from healthy individuals and PLWH. *Indicate which population, according to the expression of HLA-DR and CD38, had the highest frequency of IL-17+ or IFN-γ+ cells, respectively, when healthy individuals or PLWH were analyzed independently (P ≤ 0.02, Dunn's post-hoc test). (G) HLA-DR and/or CD38-expressing total Tc17/Tc1 cells ratio in healthy individuals and PLWH. (H) Representative pseudocolor plots of the expression of IL-17 and IFN-γ in HLA-DR/CD38-expressing CD8+ T-cells after Gag peptides stimulation in a representative patient living with HIV. (I,J) Frequency of IL-17+ (I) and IFN-γ+ (J) cells among HLA-DR- and/or CD38-expressing Gag-stimulated CD8+ T-cells from PLWH. *P ≤ 0.04 vs. all the groups; Dunn's post-hoc test. (K) HLA-DR and/or CD38-expressing HIV-specific Tc17/Tc1 cells ratio in PLWH. (L) Cell ACCENSE t-SNE plots of CD8, HLA-DR, CD38, IL-17, and IFN-γ expression in polyclonally-stimulated cells from a representative healthy individual and a subject living with HIV (M = 30,000). The black and red circles indicate, respectively, IL-17- and IFN-γ-positive CD8+ T-cells. (M,N) Correlation between the IL-17 (M) and IFN-γ (N) relative expression units and that of CD38 and HLA-DR. A total of 30,000 cells were collected from all the healthy individuals and PLWH, and computed. The r and P-value of the Pearson test are shown. In (B,E–G) the P-value of the Mann-Whitney test is shown. NS, Not statistically significant.

