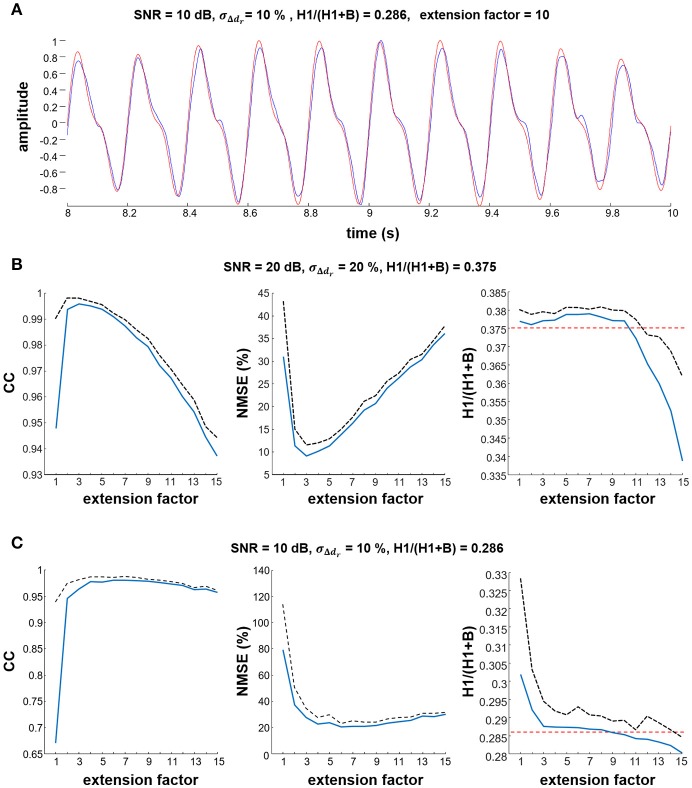
Figure 2.
Estimation of the simulated tremor component. (A) Representative example showing that the estimated tremor component (blue line) was similar to the simulated source (red line). In this example, simulation parameters were SNR = 10 dB and σΔdr = 10%. (B,C) impact of different values of the extension factor F on the estimated cross-correlation coefficient (CC), the NMSE between estimated and reference tremor component, and the H1/(H1+B) ratio. Results are averaged over 10 simulation runs. Mean values are depicted as thick blue lines, standard deviations as black dashed lines. In the H1/(H1+B) ratio plots, the simulated reference values are depicted with red dashed lines.

