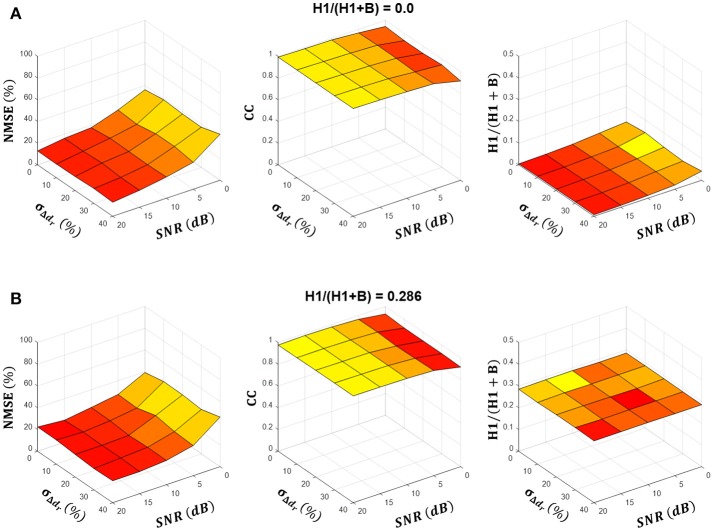
Figure 3.
Summary results of estimation of the tremor component across simulated conditions. (A,B) show the NMSE and the cross-correlation (CC) between the estimated and simulated tremor source, and the estimated H1/(H1+B) ratio as a function of parameters SNR and σΔdr for simulated H1/(H1+B) ratios of 0.0 and 0.286, respectively. Results are averaged over ten simulation runs and depicted as a mean (colored surfaces) and mean + SD (black lines). Note that SD was negligibly small.

