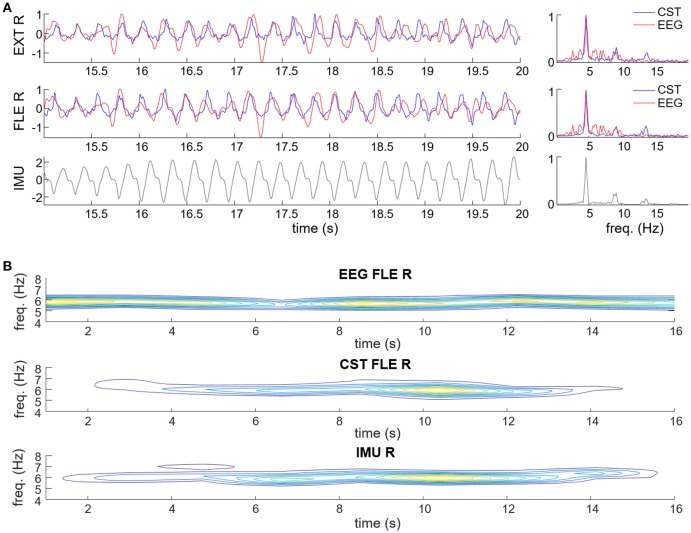
Figure 5.
Examples of estimation of the tremor-related cortical activity in experimental recordings of a representative PD (A) and ET patient (B). (A) Estimated tremor EEG component (red traces) compared to smoothed CST (blue traces) of the right wrist flexor (FLE R) and extensor muscles (EXT R), and wrist acceleration (IMU; displayed in black). Data are plotted in time (left plots) and frequency domain (right plots). (B) Contour plots of the spectrograms of the extracted tremor-related EEG component, smoothed CST of right wrist flexor (CST FLE R) and right wrist acceleration. Warmer colors represent higher power.

