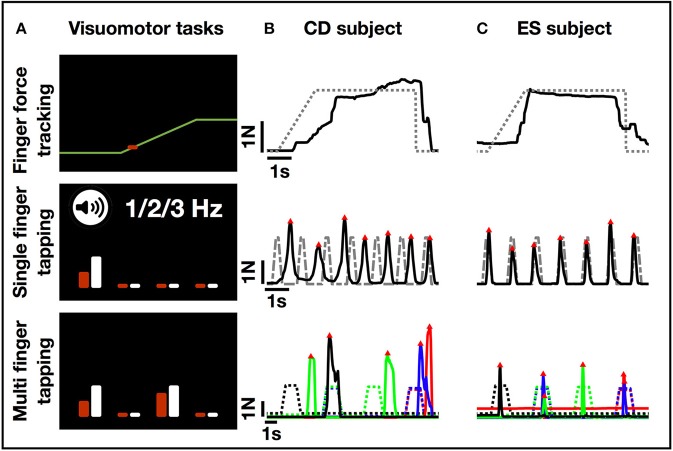
Figure 2.
FFM task display and single trial performance examples. (A) Examples from the visual display of the three FFM tasks. In the finger force tracking task, the subject matched the force applied on the piston (represented as a red cursor that moves vertically as a function of force) to the target force trajectory (yellow right-to-left moving line) displayed on computer screen. In the single finger tapping task, the subject performed repeated tapping with a single finger following auditory cues at a given rate. The white bar on the screen indicated which finger had to perform the tapping task (here the index finger), while the red bar gave a visual feedback of which finger is being selected by the subject. The length (height) of each bar was a function of force. In the multi-finger tapping task, the subject was instructed to perform a one or two-finger tap with fingers matching the visual cues on the screen (here the instruction indicates a two-finger tap using the index and ring finger). (B) Single trial recordings from a subject in the cognitive decline (CD) group. (C) Single trial recordings from a subject in the elderly subjects (ES) group. Note: greater variability in single finger tapping and difficulty selecting correct finger to tap with in multi-finger tapping task (the performed taps do not match the cues indicated by the stippled line). Color code: blue, index; red, middle; green, ring; black, little finger. The four trials from left to right represent: a single (little) finger tap, followed by a two-finger (index, little) tap, a single (ring) finger tap, and another two-finger (index, middle) tap.

