Figure 1.
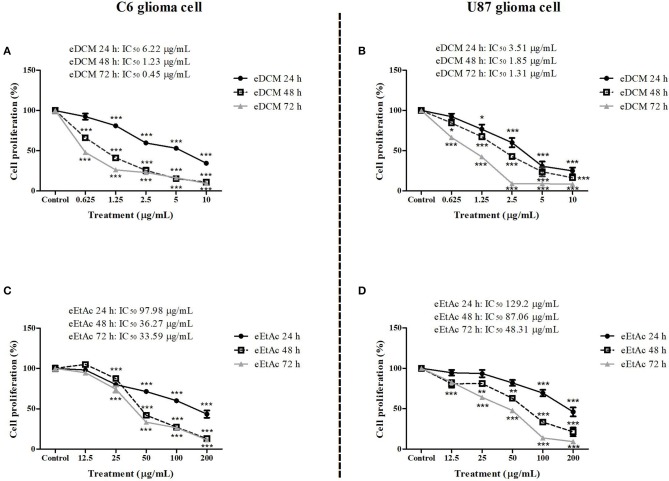
Comparative effect of eDCM and eEtAc on glioma cell proliferation. C6 (left panel) and U87MG (right panel) glioma cell lines were exposed to increasing concentrations of eDCM (A,B) and eEtAc (C,D). Cell proliferation was determined by SRB assay following 24, 48, or 72 h of treatment, as indicated. Values represent the mean ± SEM from at least three independent experiments performed in triplicate. Data were analyzed by ANOVA followed by post-hoc comparisons (Tukey test). *, **, *** Significantly different from control cells (P < 0.05, P < 0.01, and P < 0.001, respectively).

