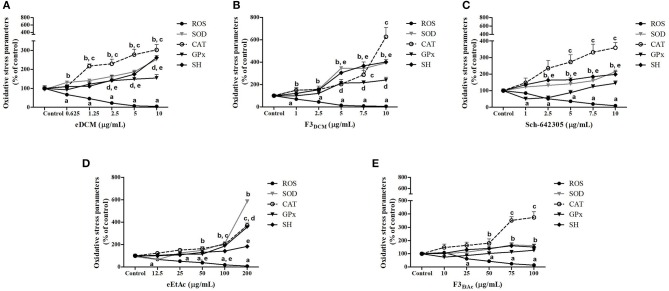
Figure 11.
Analysis of oxidative stress parameters in C6 glioma cells exposed to extracts and Sch-642305 macrolide of endophytic fungi from A. satureioides for 48 h. (A) eDCM extract; (B) F3DCM extract; (C) Sch-642305; (D) eEtAc extract and (E) F3EtAc extract. Values represent mean ± SEM of at least three independent experiments. Data were analyzed by ANOVA followed by post-hoc comparisons (Tukey test). a, b, c, d, eSignificantly different from control cells of ROS, SOD, CAT, GPx, and SH oxidative parameters, respectively.

