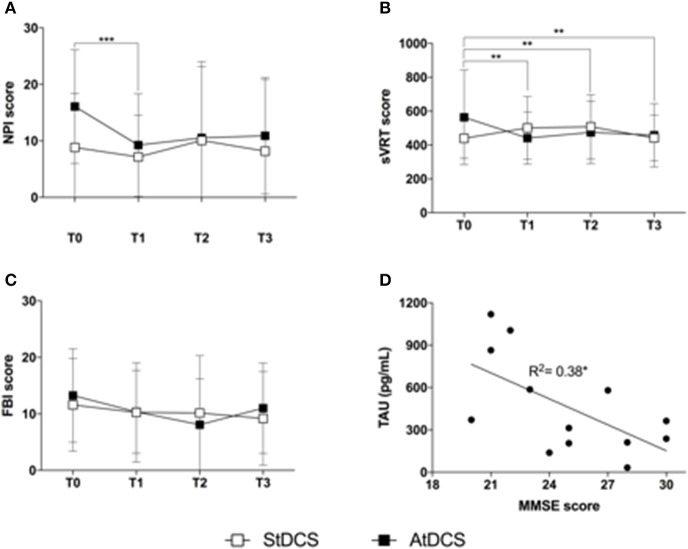
Figure 2.
Findings on clinical variables (A). Effect of Anodal (black squares) and Sham (white squares) tDCS on the Neuropsychiatric Inventory (NPI). Squares represent the average NPI score on the 12 subjects analyzed, at T0, T1, T2, and T3. Error bars are standard deviations. ***p < 0.01 at the post-hoc Wilcoxon signed ranked test with Bonferroni correction (significant); (B). Effect of Anodal (black squares) and Sham (white squares) tDCS on the simple Visual Reaction Time (sVRT) test. Squares represent the average sVRT score on the 12 subjects analyzed, at T0, T1, T2, and T3. Error bars are standard deviations. **p < 0.01 at the post-hoc Wilcoxon signed ranked test with Bonferroni correction (significant) (C). Effect of Anodal (black squares) and Sham (white squares) tDCS on the Frontal Behavioral Inventory (FBI-A). Squares represent the average FBI-A score on the 12 subjects analyzed, at T0, T1, T2, and T3. Error bars are standard deviations (D). Scatter plot of the correlation between TAU protein (pg/mL) and MMSE score. The line represents the estimated linear regression. *p < 0.05.

