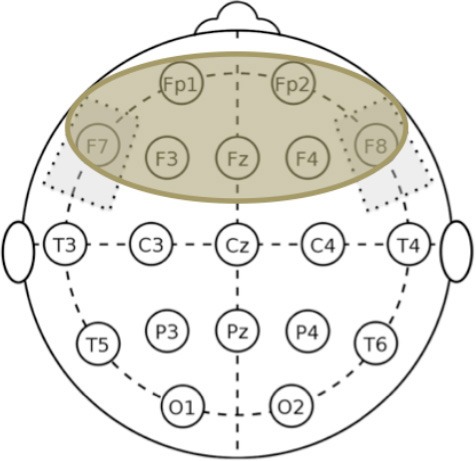
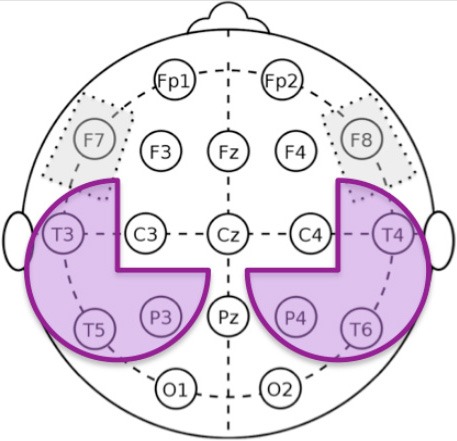
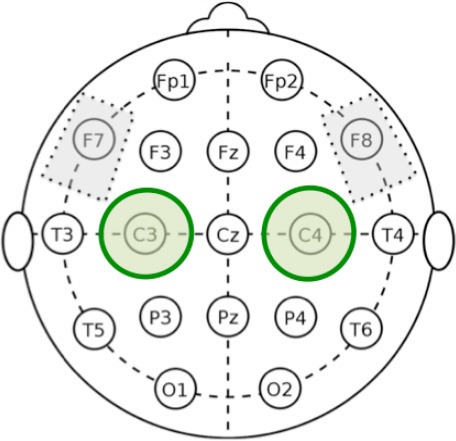
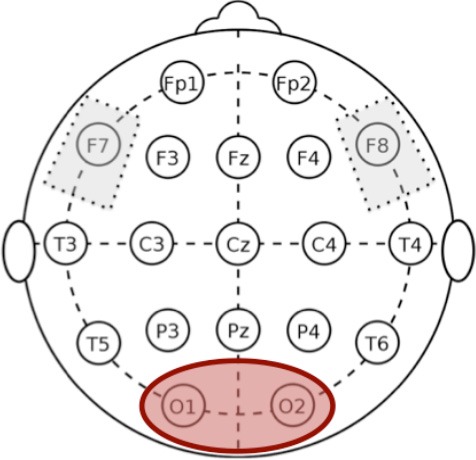
Table 2.
qEEG power in the low- and high- frequency bands at all time points and in all regions of interest.
| Area | S-tDCS | A-tDCS | |||||||||
|---|---|---|---|---|---|---|---|---|---|---|---|
| T0 | T1 | T2 | T3 | T0 | T1 | T2 | T3 | ||||
| FRONTAL |  |
LF | 14.86 ± 13.08 | 9.53 ± 10.90 | 10.36 ± 4.88 | 7.95 ± 5.95 | LF | 26.76 ± 32.74 | 20.54 ± 27.21 | 28.15 ± 30.87 | 14.35 ± 11.07 |
| HF | 5.42 ± 1.68 | 3.40 ± 1.62 | 3.87 ± 0.85 | 4.85 ± 1.59 | HF | 5.98 ± 2.81 | 4.80 ± 1.68 | 4.85 ± 1.84 | 5.14 ± 2.09 | ||
| TEMPO-PARIETAL |  |
LF | 30.41 ± 26.43 | 19.42 ± 22.31 | 18.13 ± 9.26 | 14.78 ± 9.55 | LF | 52.38 ± 71.09 | 41.99 ± 57.71 | 58.72 ± 66.36 | 27.13 ± 26.02 |
| HF | 9.48 ± 2.29 | 6.98 ± 3.70 | 6.42 ± 2.30 | 7.44 ± 2.61 | HF | 19.45 ± 18.28 | 12.65 ± 7.42 | 14.23 ± 8.76 | 15.77 ± 7.73 | ||
| CENTRAL |  |
LF | 27.12 ± 22.98 | 18.09 ± 17.41 | 15.74 ± 12.74 | 10.44 ± 10.45 | LF | 49.22 ± 69.20 | 44.15 ± 60.68 | 48.57 ± 60.68 | 19.39 ± 22.18 |
| HF | 9.69 ± 6.13 | 7.79 ± 4.25 | 6.00 ± 1.28 | 5.34 ± 4.48 | HF | 12.18 ± 8.52 | 10.37 ± 9.31 | 10.04 ± 10.25 | 9.62 ± 7.09 | ||
| OCCIPITAL |  |
LF | 48.46 ± 29.43 | 39.86 ± 30.02 | 46.13 ± 37.49 | 29.64 ± 34.11 | LF | 89.11 ± 107.82 | 70.74 ± 82.90 | 86.16 ± 105.10 | 40.18 ± 42.29 |
| HF | 30.56 ± 18.28 | 29.06 ± 24.48 | 27.99 ± 39.35 | 25.35 ± 45.79 | HF | 59.75 ± 90.60 | 32.34 ± 28.84 | 35.23 ± 33.71 | 32.05 ± 34.33 | ||
