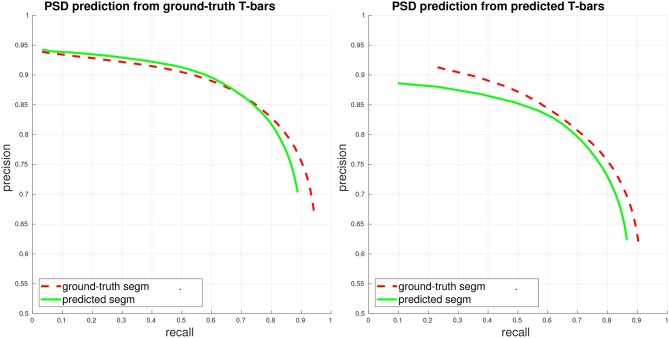
Figure 3.
PSD precision/recall, where each PSD is considered separately (weighted view of connectome graph, see section 4). Performance is computed both when access to the ground-truth segmentation is available during PSD detection (ground-truth/gt segm), and when only the fully-automated, predicted segmentation is available during PSD detection (predicted/pd segm). (Left) Plot of PSD prediction performance in isolation, using ground-truth T-bar locations. (Right) Plot of end-to-end performance, using predicted T-bar locations.

